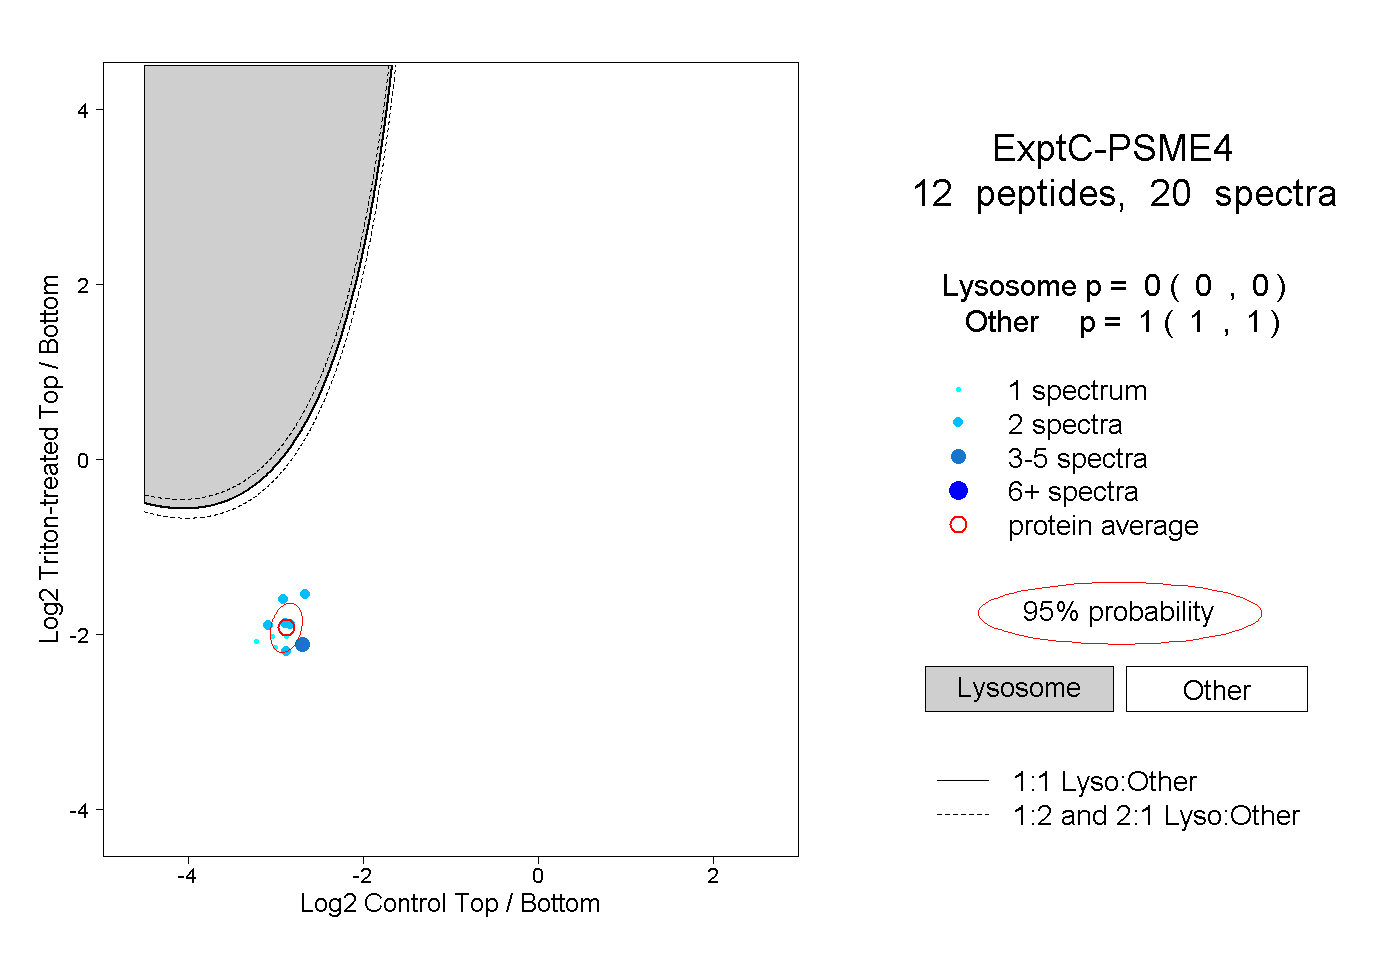
20
20peptides
spectra
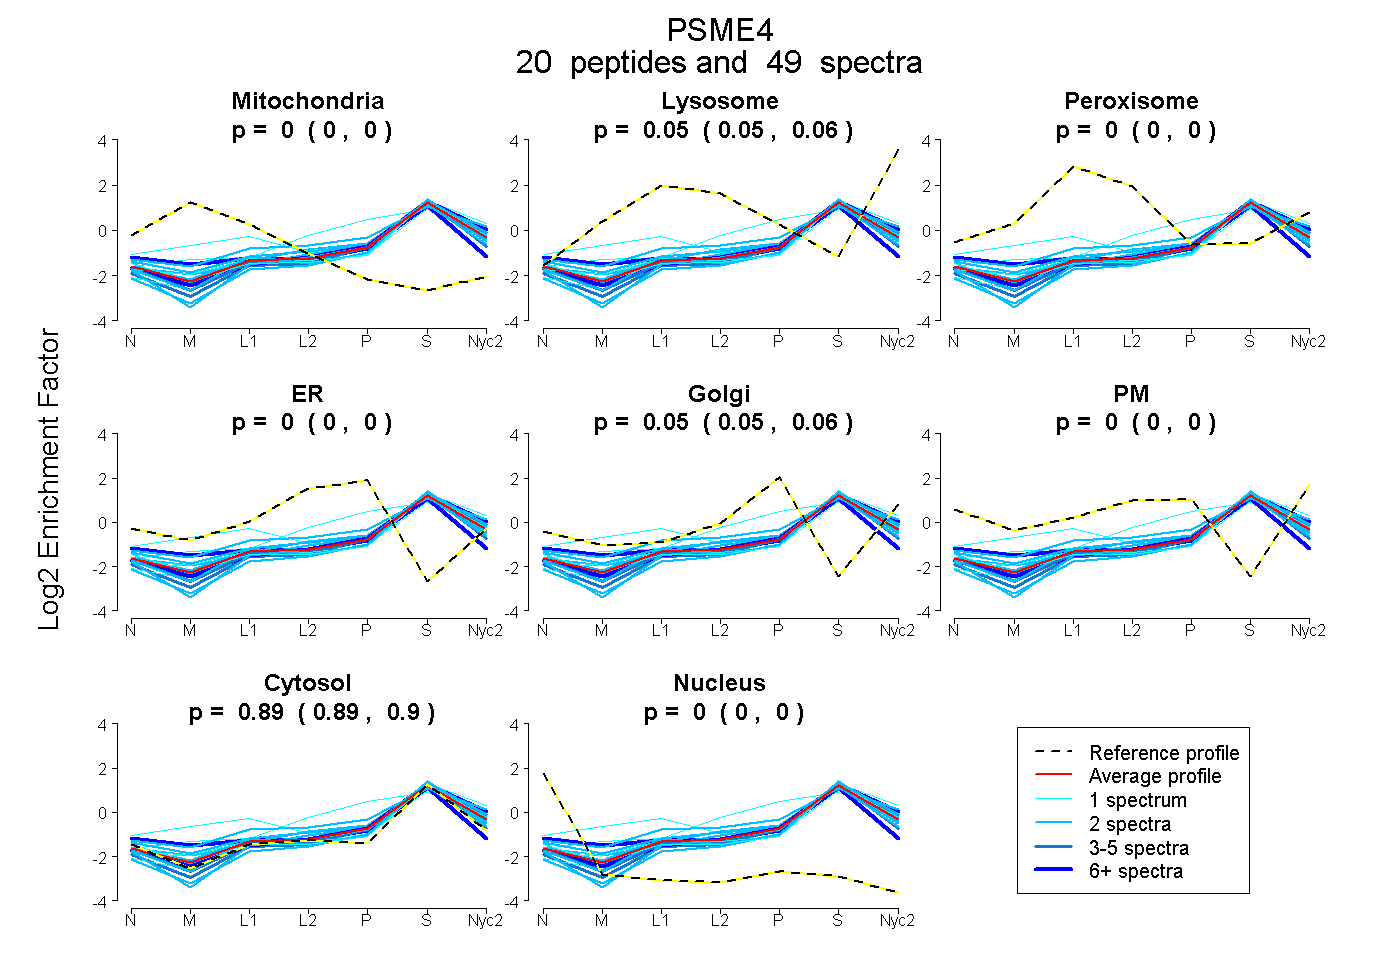
0.000 | 0.000
0.048 | 0.055
0.000 | 0.000
0.000 | 0.000
0.051 | 0.058
0.000 | 0.000
0.891 | 0.896
0.000 | 0.000
7peptides
spectra
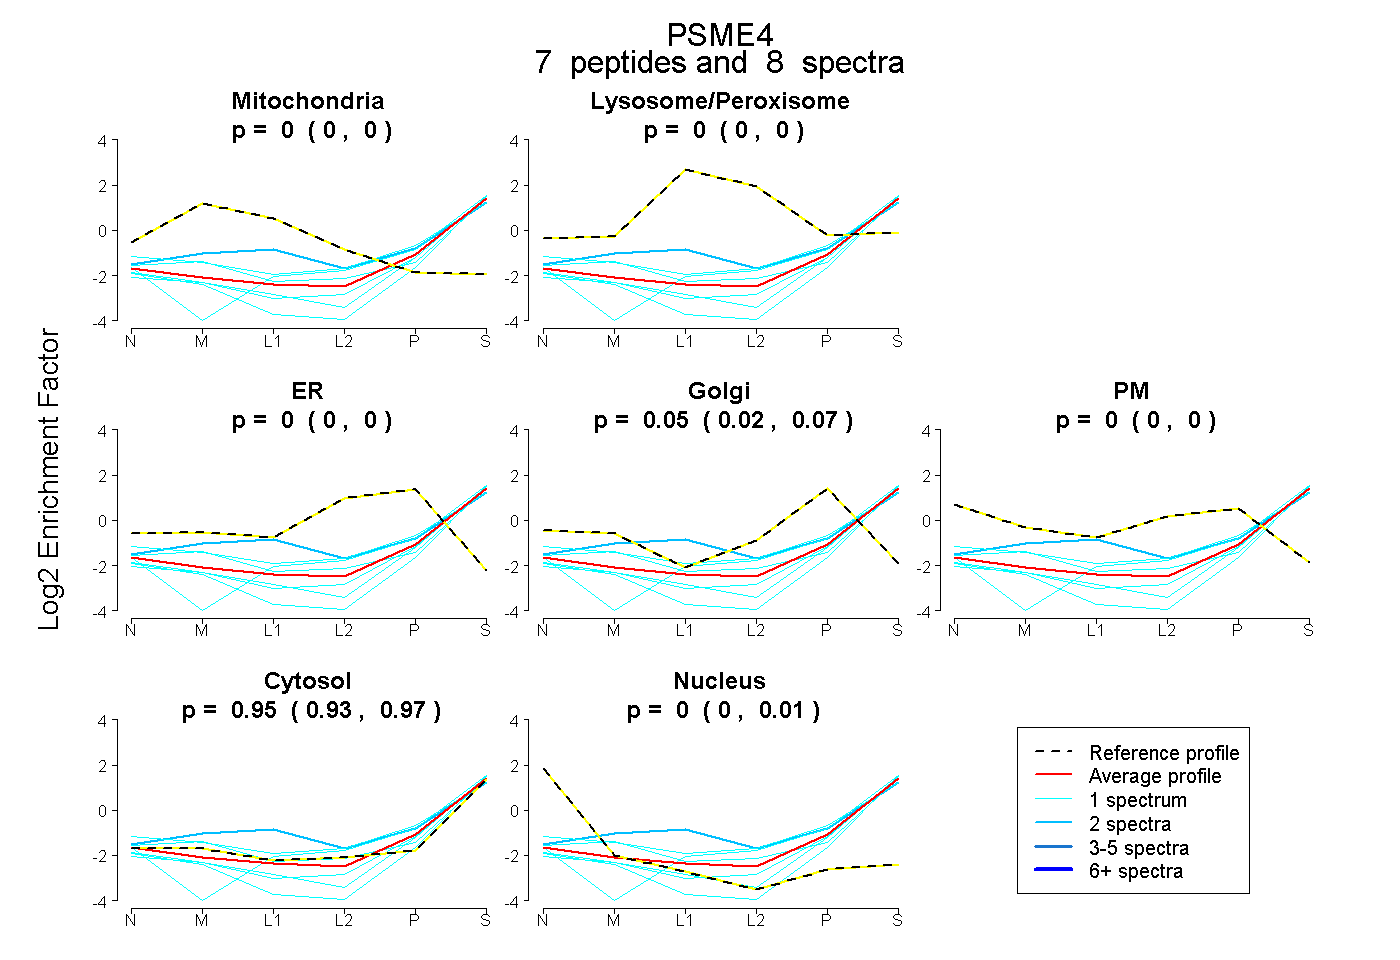
0.000 | 0.000
0.000 | 0.000
0.000 | 0.000
0.024 | 0.066
0.000 | 0.000
0.930 | 0.969
0.000 | 0.007