 7
7peptides
spectra
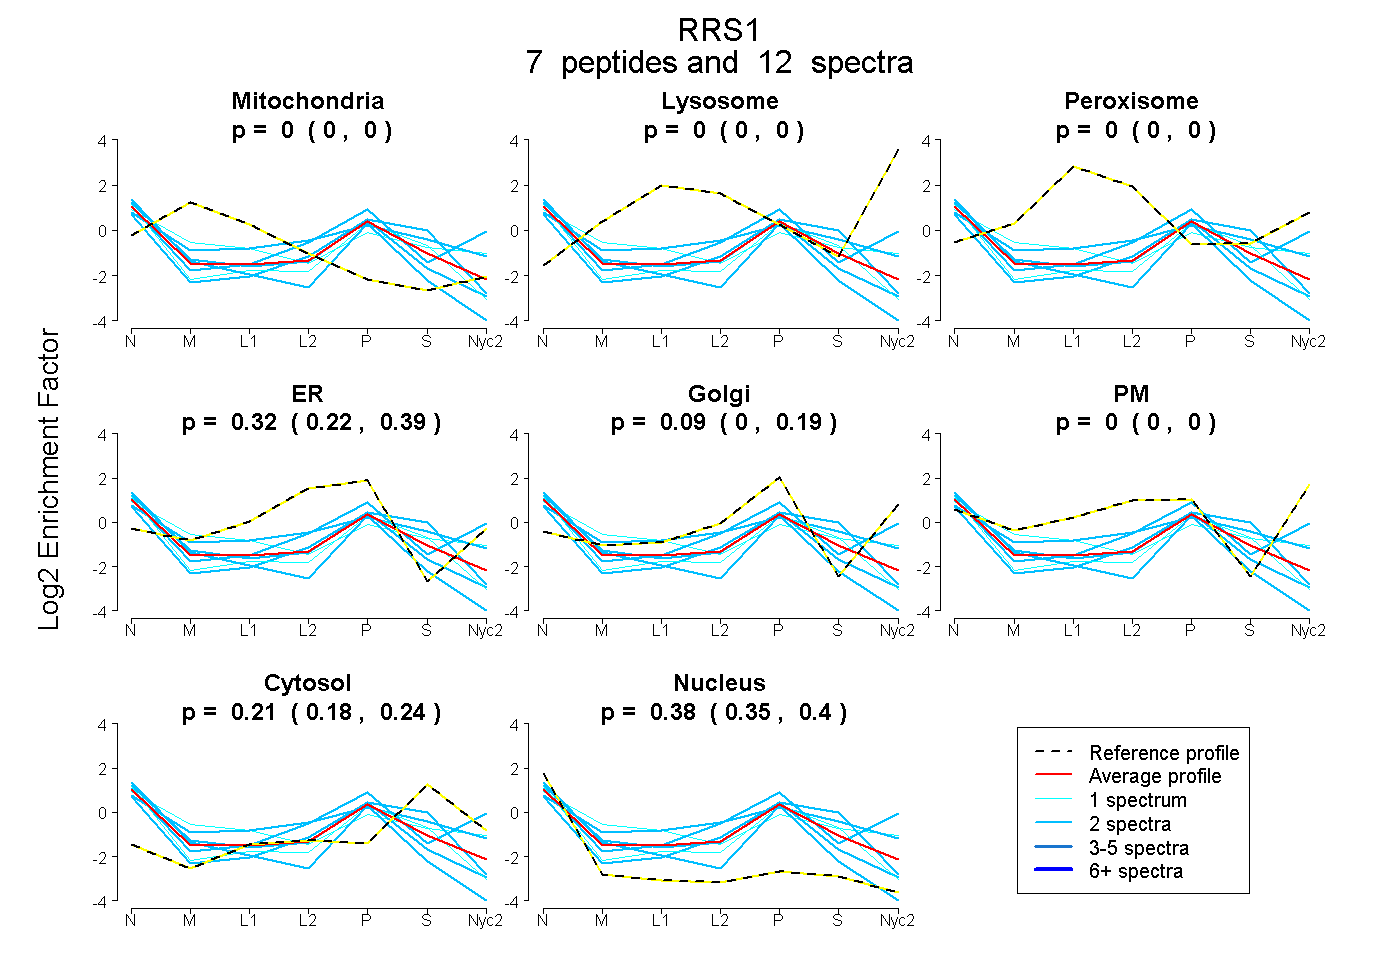
0.000 | 0.000
0.000 | 0.000
0.000 | 0.000
0.220 | 0.391
0.000 | 0.187
0.000 | 0.000
0.182 | 0.238
0.349 | 0.403
1peptide
spectrum
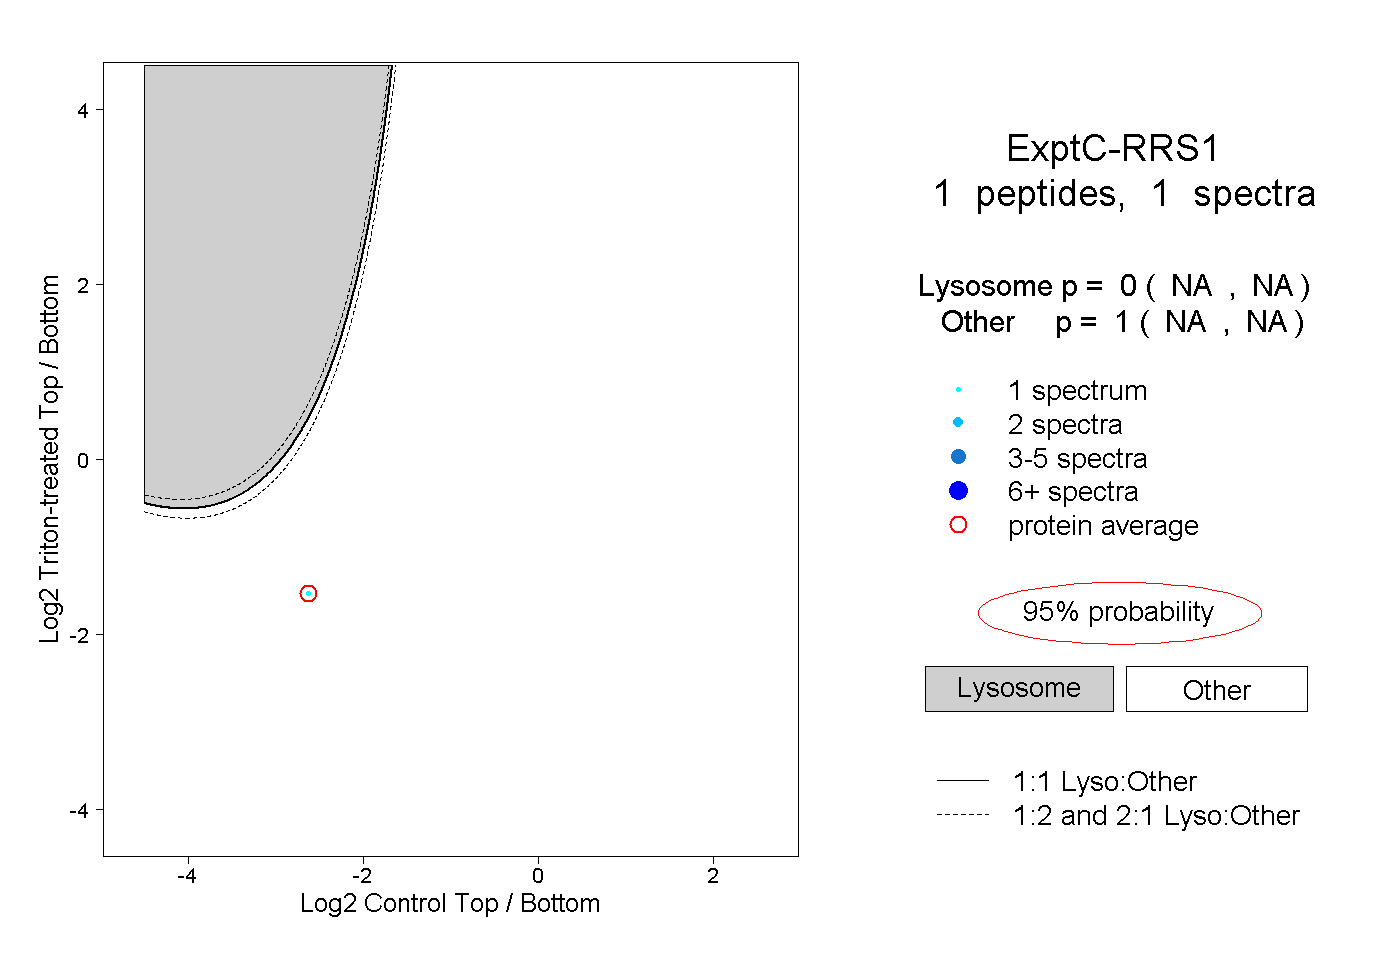
NA | NA
NA | NA
| Plot | Mito | Lyso | Perox | ER | Golgi | PM | Cytosol | Nucleus | |||||
| Expt A |
7 peptides |
12 spectra |
|
0.000 0.000 | 0.000 |
0.000 0.000 | 0.000 |
0.000 0.000 | 0.000 |
0.317 0.220 | 0.391 |
0.093 0.000 | 0.187 |
0.000 0.000 | 0.000 |
0.212 0.182 | 0.238 |
0.379 0.349 | 0.403 |
||
| Plot | Lyso | Other | |||||||||||
| Expt C |
1 peptide |
1 spectrum |
|
0.000 NA | NA |
1.000 NA | NA |