 46
46peptides
spectra

0.000 | 0.000
0.434 | 0.436
0.000 | 0.000
0.000 | 0.000
0.105 | 0.107
0.000 | 0.000
0.458 | 0.459
0.000 | 0.000
36peptides
spectra
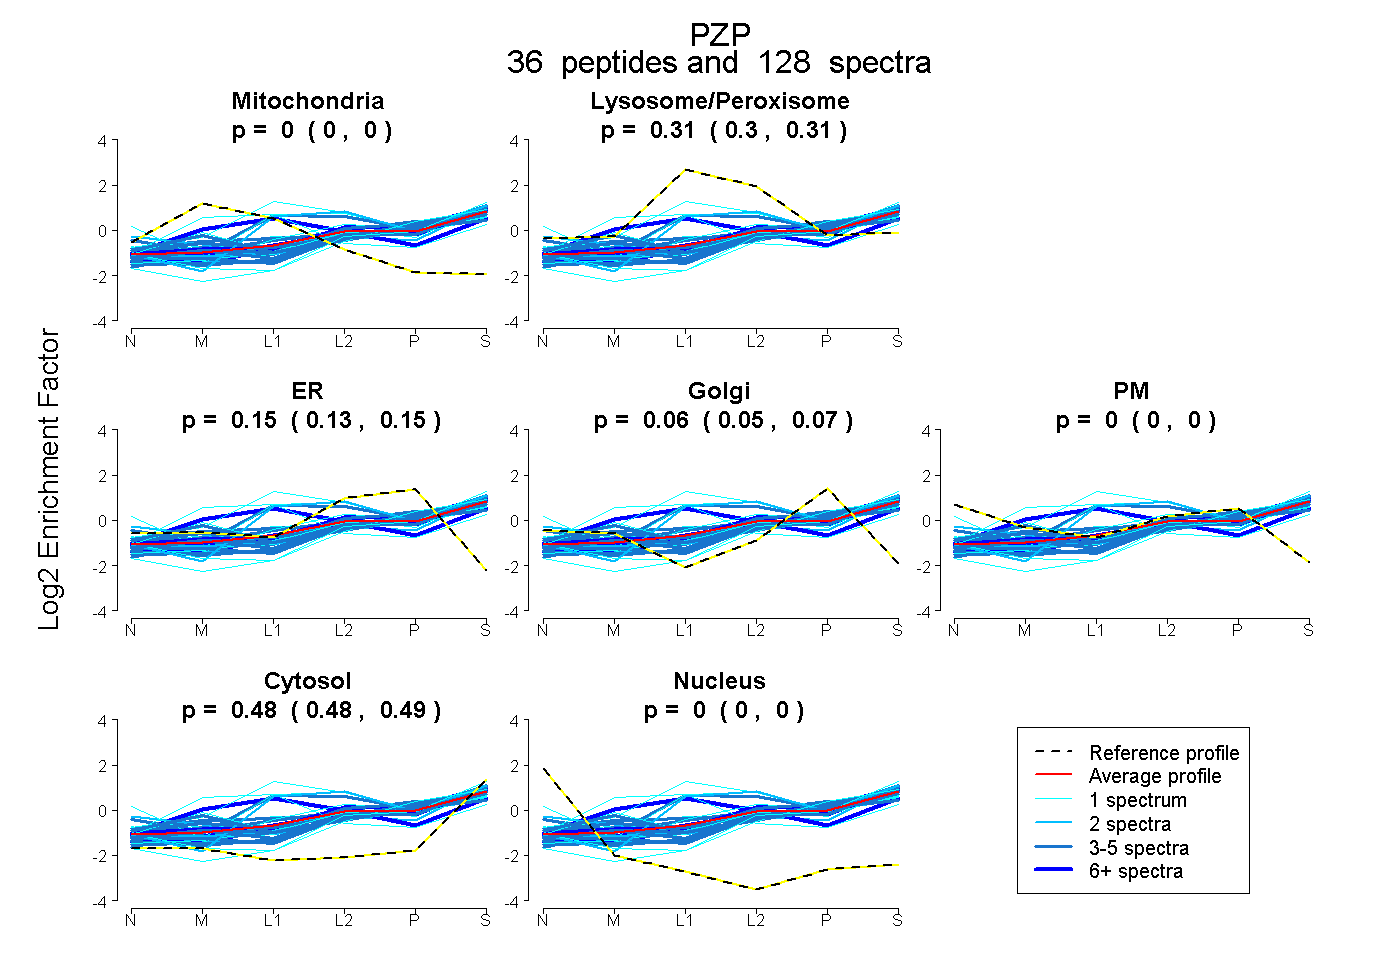
0.000 | 0.000
0.302 | 0.313
0.133 | 0.155
0.054 | 0.073
0.000 | 0.000
0.479 | 0.485
0.000 | 0.000
46peptides
spectra
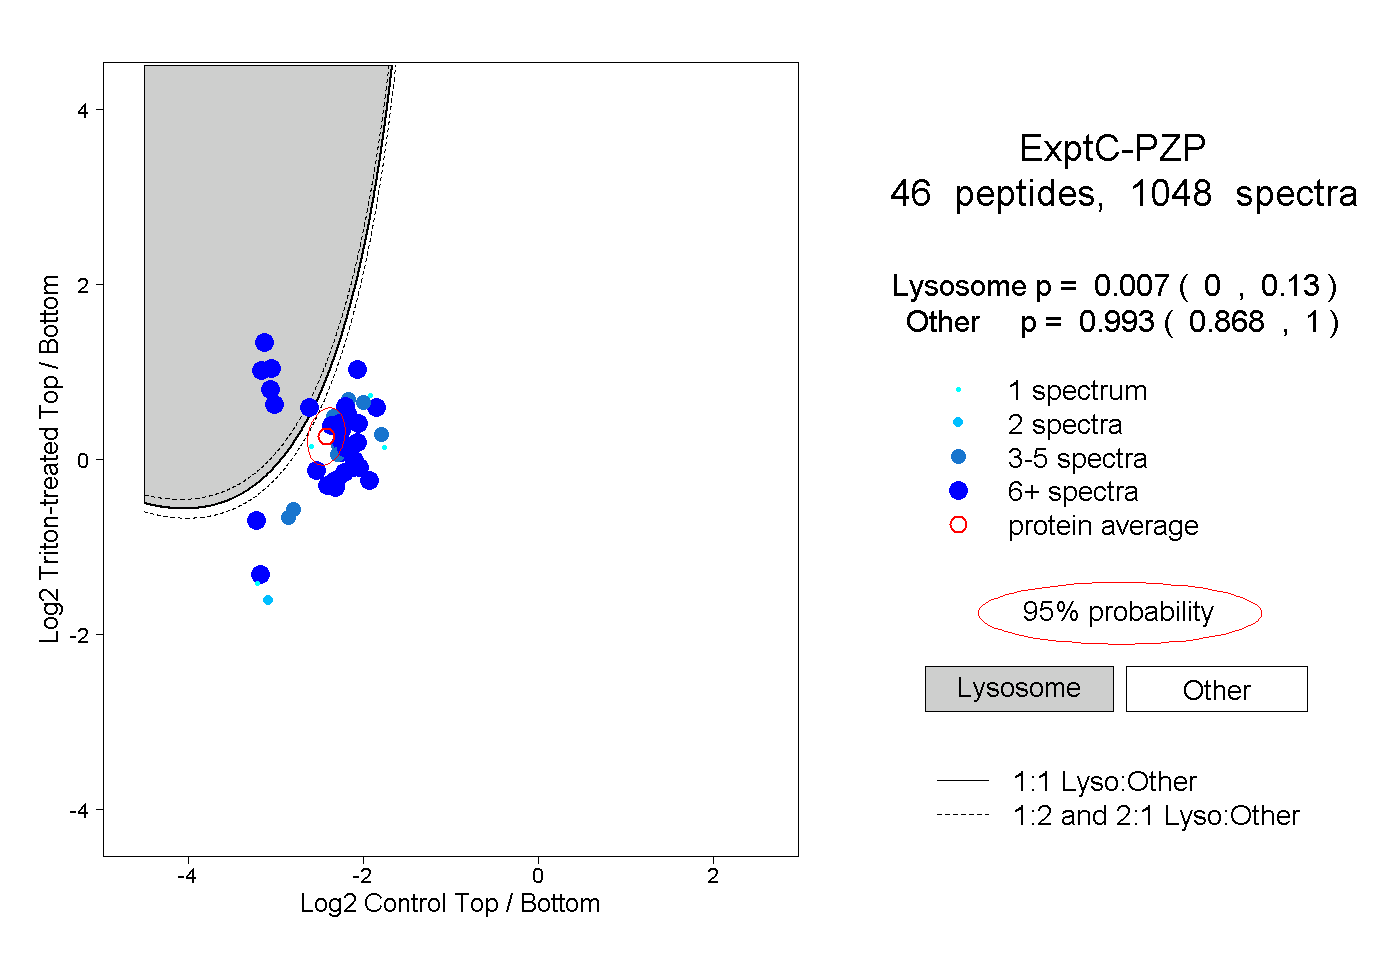
0.000 | 0.130
0.868 | 1.000
25peptides
spectra
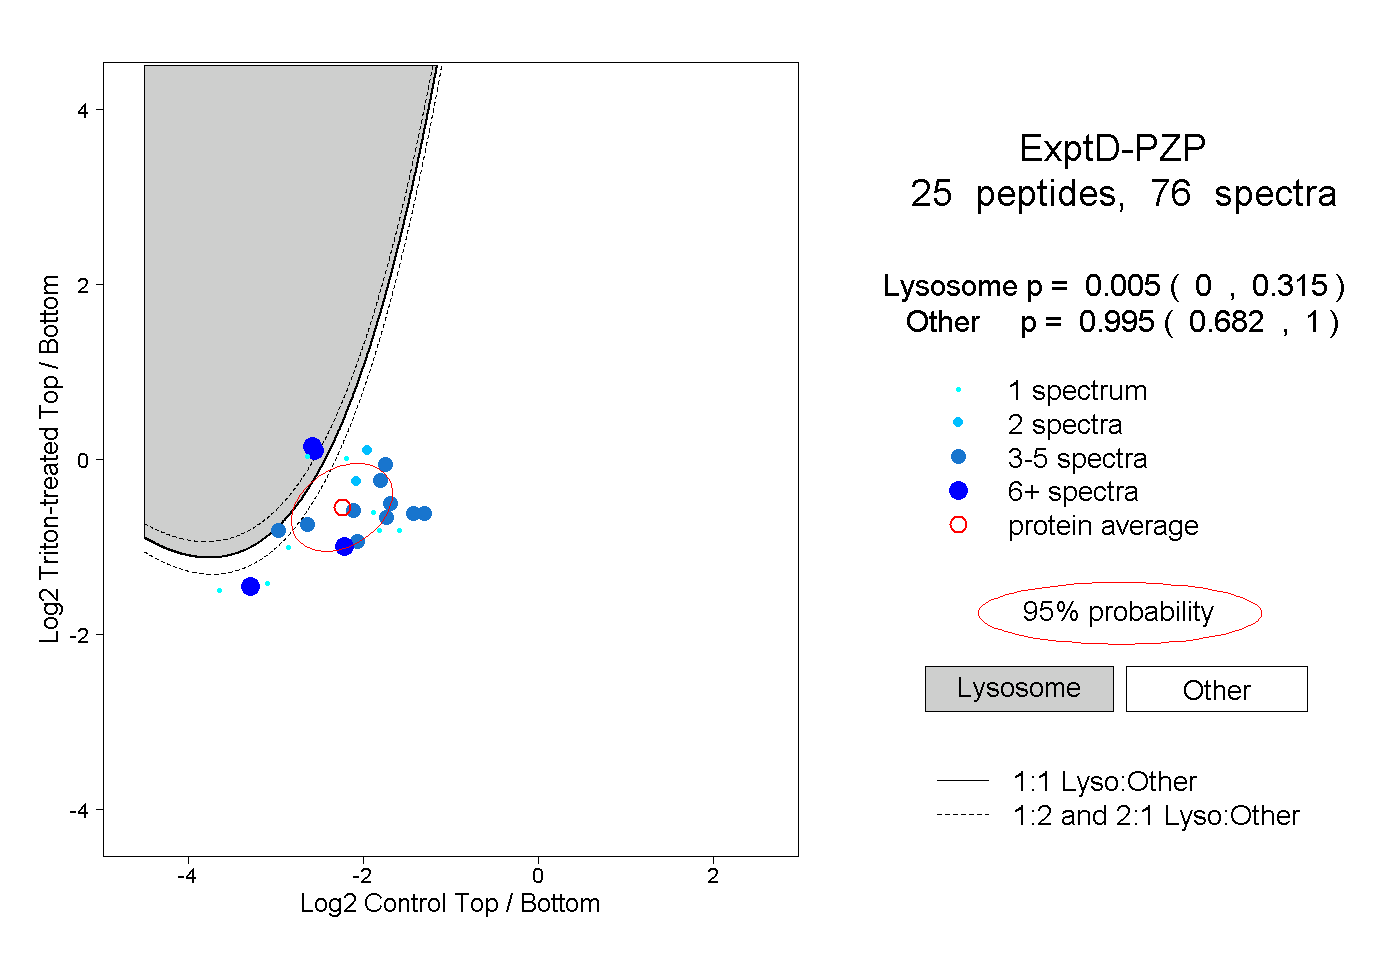
0.000 | 0.315
0.682 | 1.000