6
6peptides
spectra
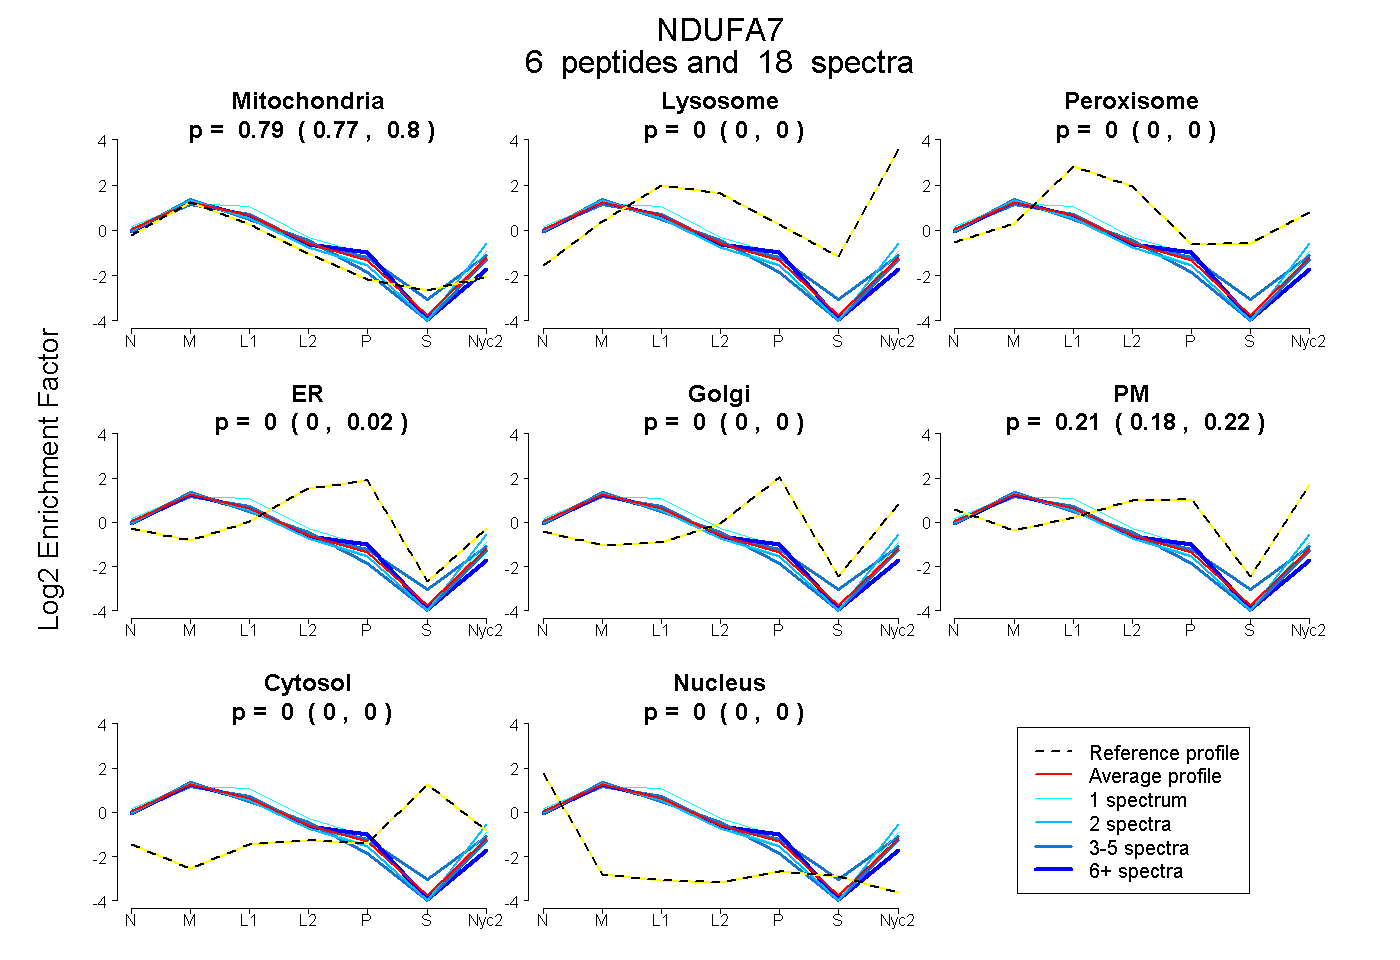
0.775 | 0.798
0.000 | 0.000
0.000 | 0.000
0.000 | 0.022
0.000 | 0.000
0.181 | 0.223
0.000 | 0.000
0.000 | 0.000
3peptides
spectra
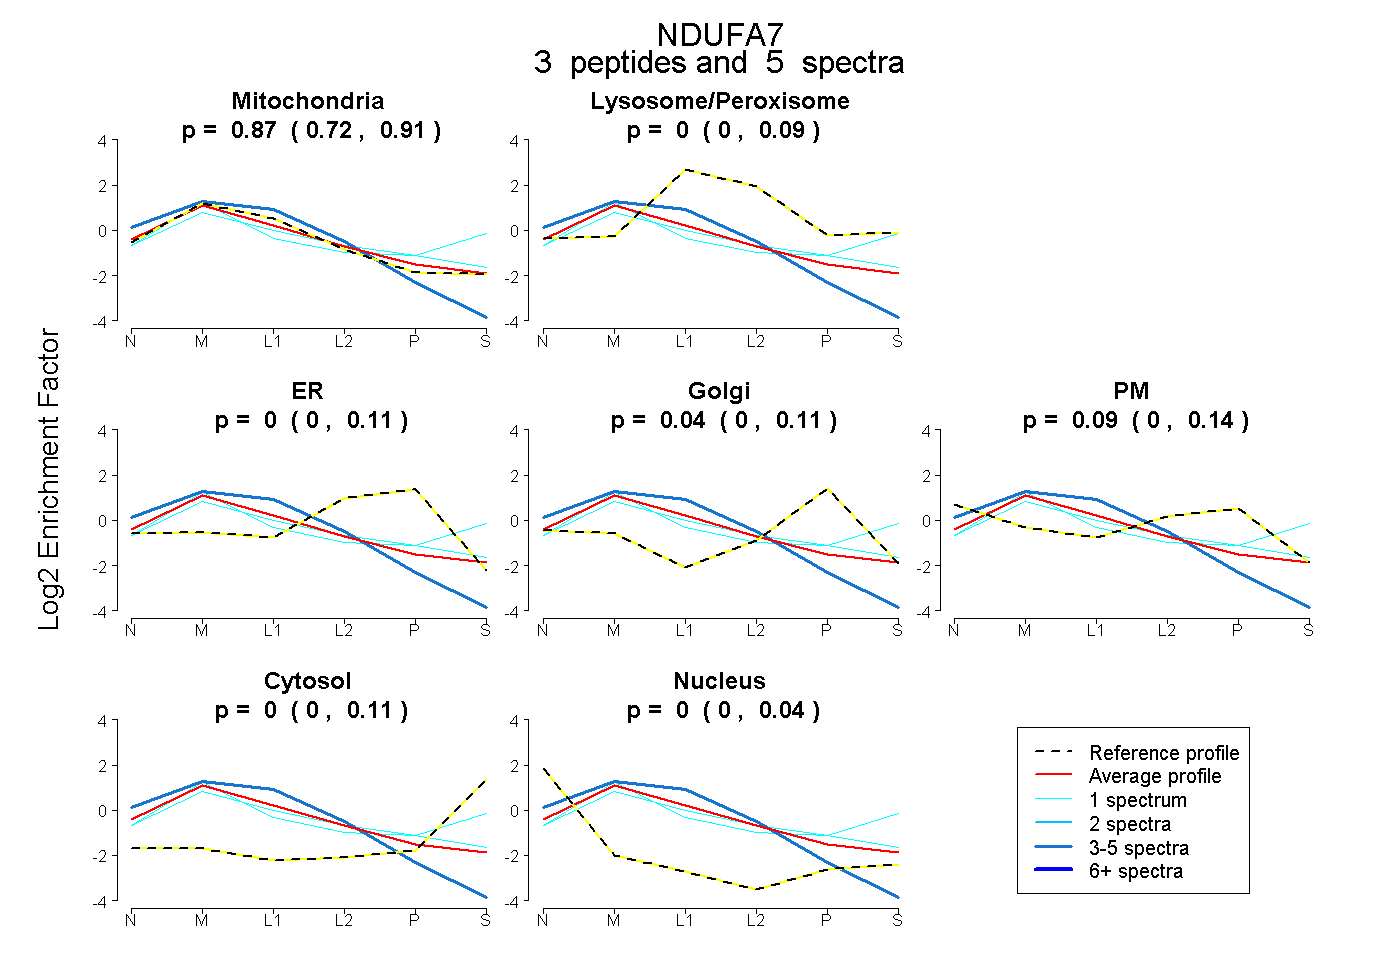
0.718 | 0.911
0.000 | 0.094
0.000 | 0.109
0.000 | 0.105
0.000 | 0.144
0.000 | 0.112
0.000 | 0.041