 6
6peptides
spectra
0.775 | 0.798
0.000 | 0.000
0.000 | 0.000
0.000 | 0.022
0.000 | 0.000
0.181 | 0.223
0.000 | 0.000
0.000 | 0.000
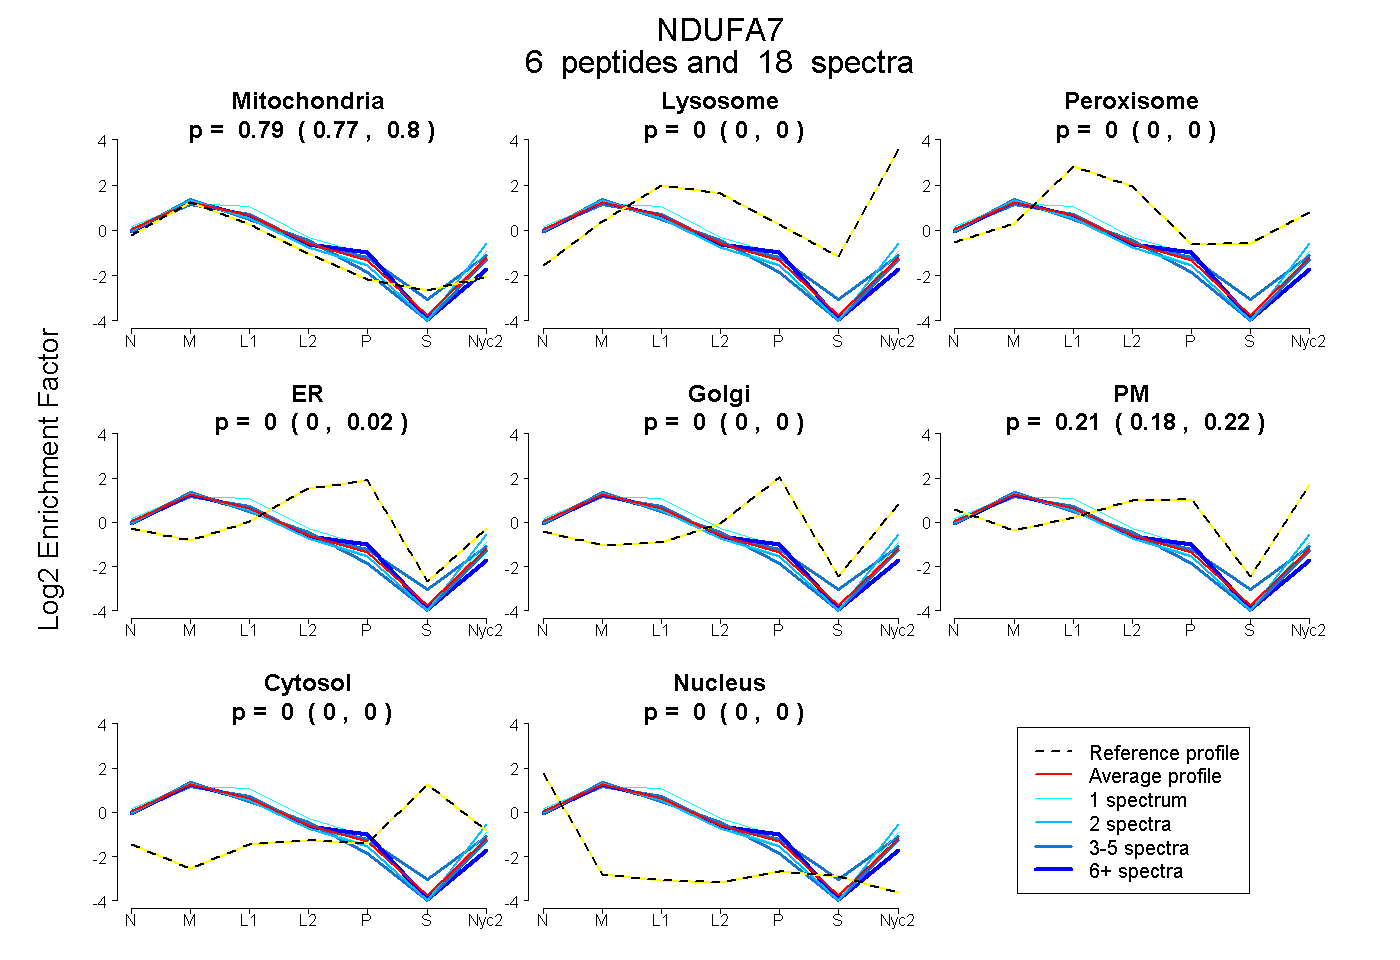
| Plot | Mito | Lyso | Perox | ER | Golgi | PM | Cytosol | Nucleus | |||||
| Expt A |
6 peptides |
18 spectra |
|
0.788 0.775 | 0.798 |
0.000 0.000 | 0.000 |
0.000 0.000 | 0.000 |
0.000 0.000 | 0.022 |
0.000 0.000 | 0.000 |
0.212 0.181 | 0.223 |
0.000 0.000 | 0.000 |
0.000 0.000 | 0.000 |
| 2 spectra, TAESSAVAATK | 0.750 | 0.000 | 0.000 | 0.000 | 0.000 | 0.250 | 0.000 | 0.000 | ||
| 3 spectra, NWASGQDLQAK | 0.853 | 0.000 | 0.000 | 0.000 | 0.000 | 0.147 | 0.000 | 0.000 | ||
| 5 spectra, EVVPPSIIMSSQK | 0.755 | 0.009 | 0.002 | 0.000 | 0.000 | 0.234 | 0.000 | 0.000 | ||
| 1 spectrum, AVTPAPPMK | 0.801 | 0.000 | 0.000 | 0.000 | 0.000 | 0.199 | 0.000 | 0.000 | ||
| 6 spectra, LSNNYYCTR | 0.793 | 0.000 | 0.000 | 0.207 | 0.000 | 0.000 | 0.000 | 0.000 | ||
| 1 spectrum, LPVGPSHK | 0.706 | 0.000 | 0.000 | 0.003 | 0.000 | 0.291 | 0.000 | 0.000 |
| Plot | Mito | Lyso or Perox | ER | Golgi | PM | Cytosol | Nucleus | ||||||
| Expt B |
3 peptides |
5 spectra |
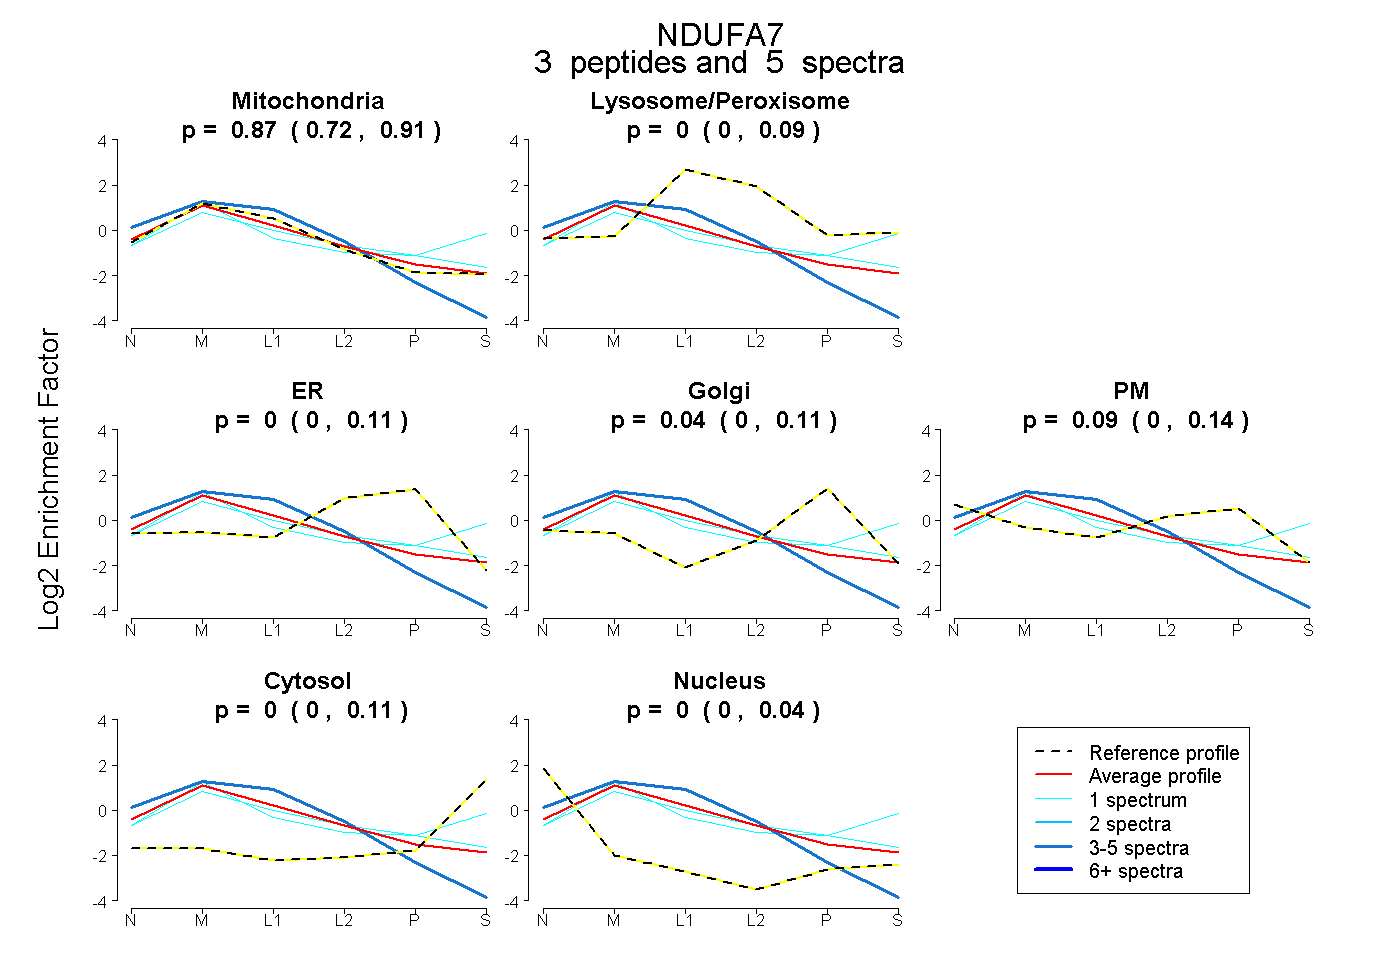 |
0.867 0.718 | 0.911 |
0.000 0.000 | 0.094 |
0.000 0.000 | 0.109 |
0.040 0.000 | 0.105 |
0.093 0.000 | 0.144 |
0.000 0.000 | 0.112 |
0.000 0.000 | 0.041 |
|||
| Plot | Lyso | Other | |||||||||||
| Expt C |
9 peptides |
152 spectra |
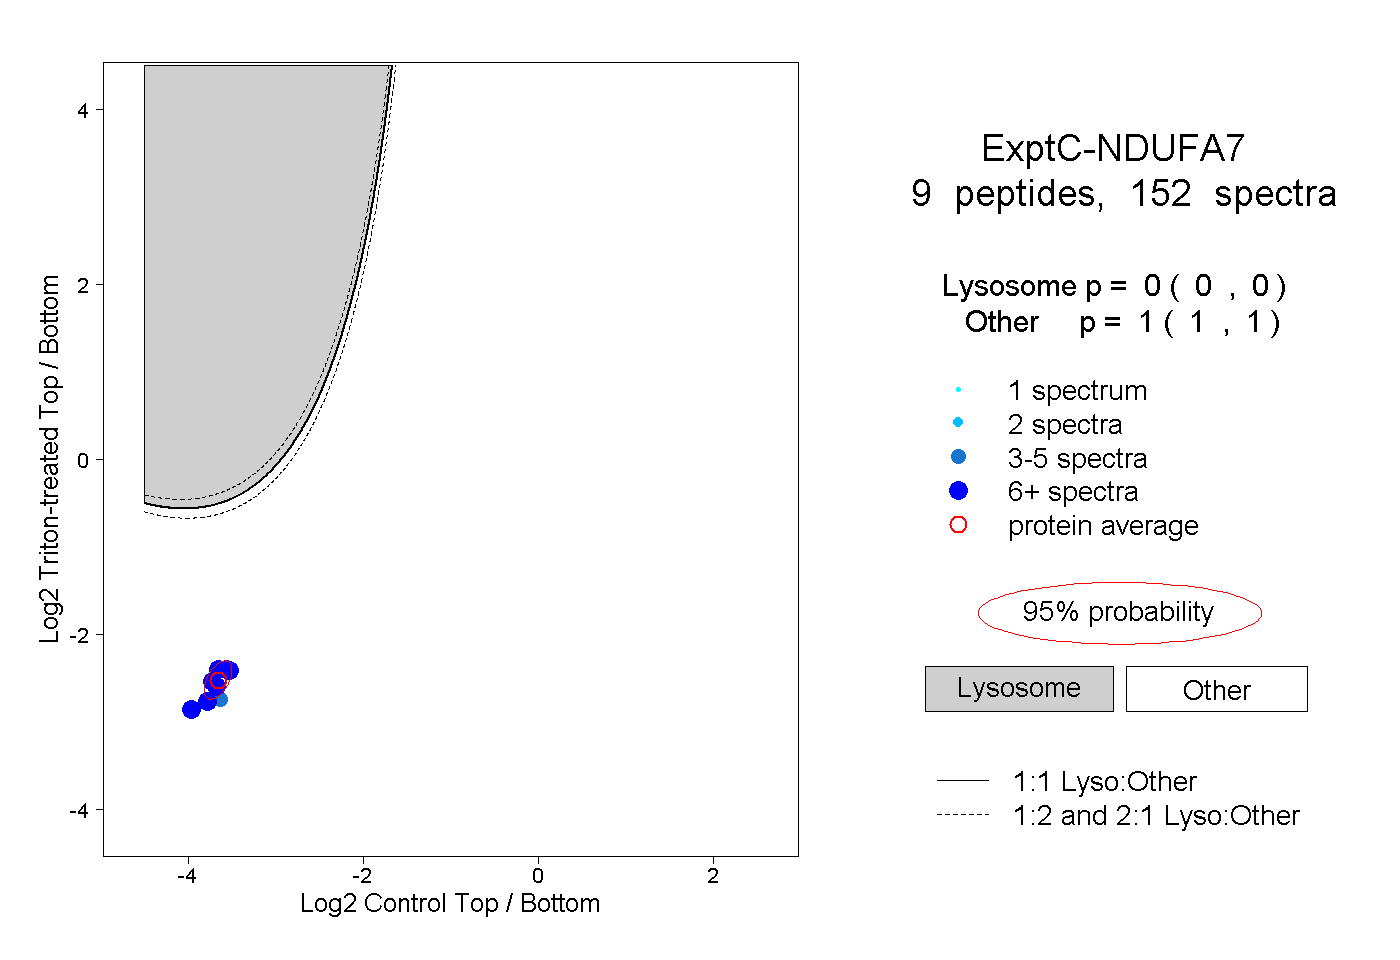 |
0.000 0.000 | 0.000 |
1.000 1.000 | 1.000 |
||||||||
| Plot | Lyso | Other | |||||||||||
| Expt D |
7 peptides |
10 spectra |
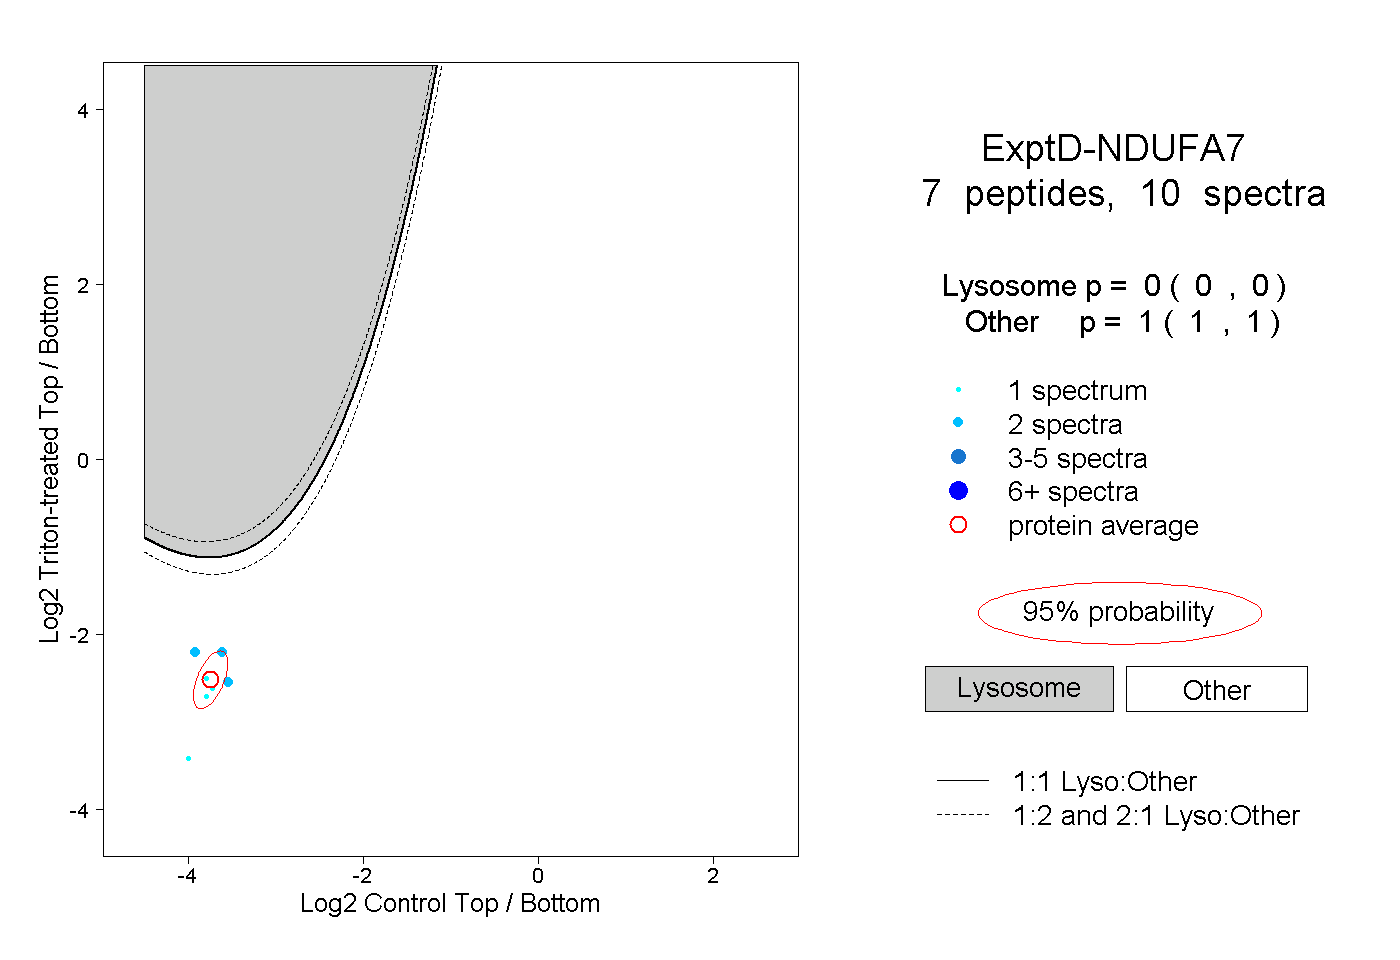 |
0.000 0.000 | 0.000 |
1.000 1.000 | 1.000 |