11
11peptides
spectra
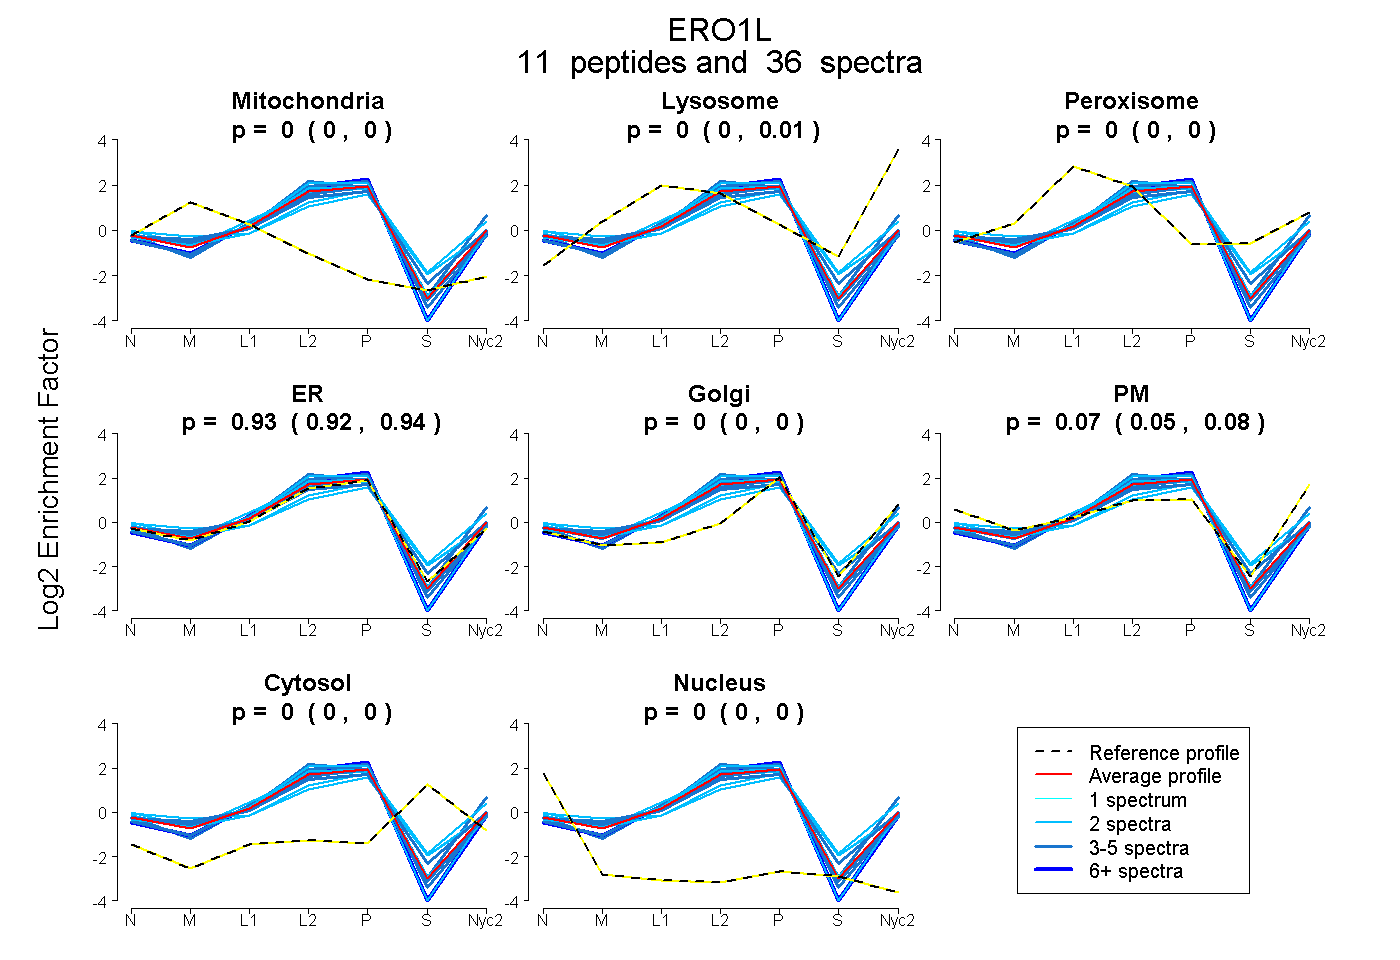
0.000 | 0.000
0.000 | 0.012
0.000 | 0.000
0.918 | 0.939
0.000 | 0.000
0.050 | 0.077
0.000 | 0.000
0.000 | 0.000
9peptides
spectra
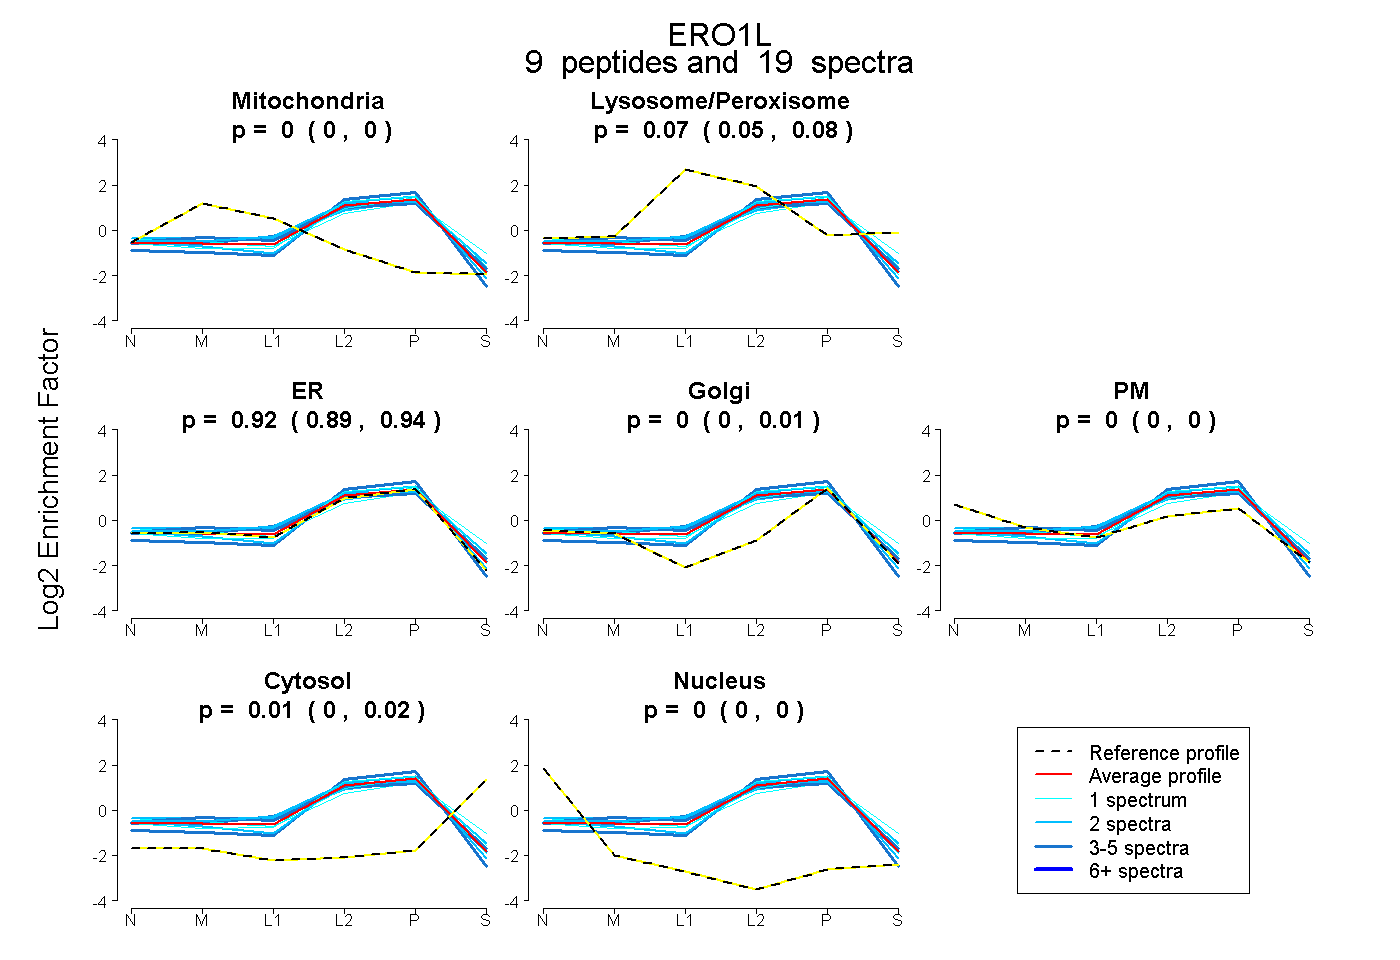
0.000 | 0.000
0.052 | 0.078
0.894 | 0.939
0.000 | 0.014
0.000 | 0.000
0.002 | 0.021
0.000 | 0.000