 11
11peptides
spectra
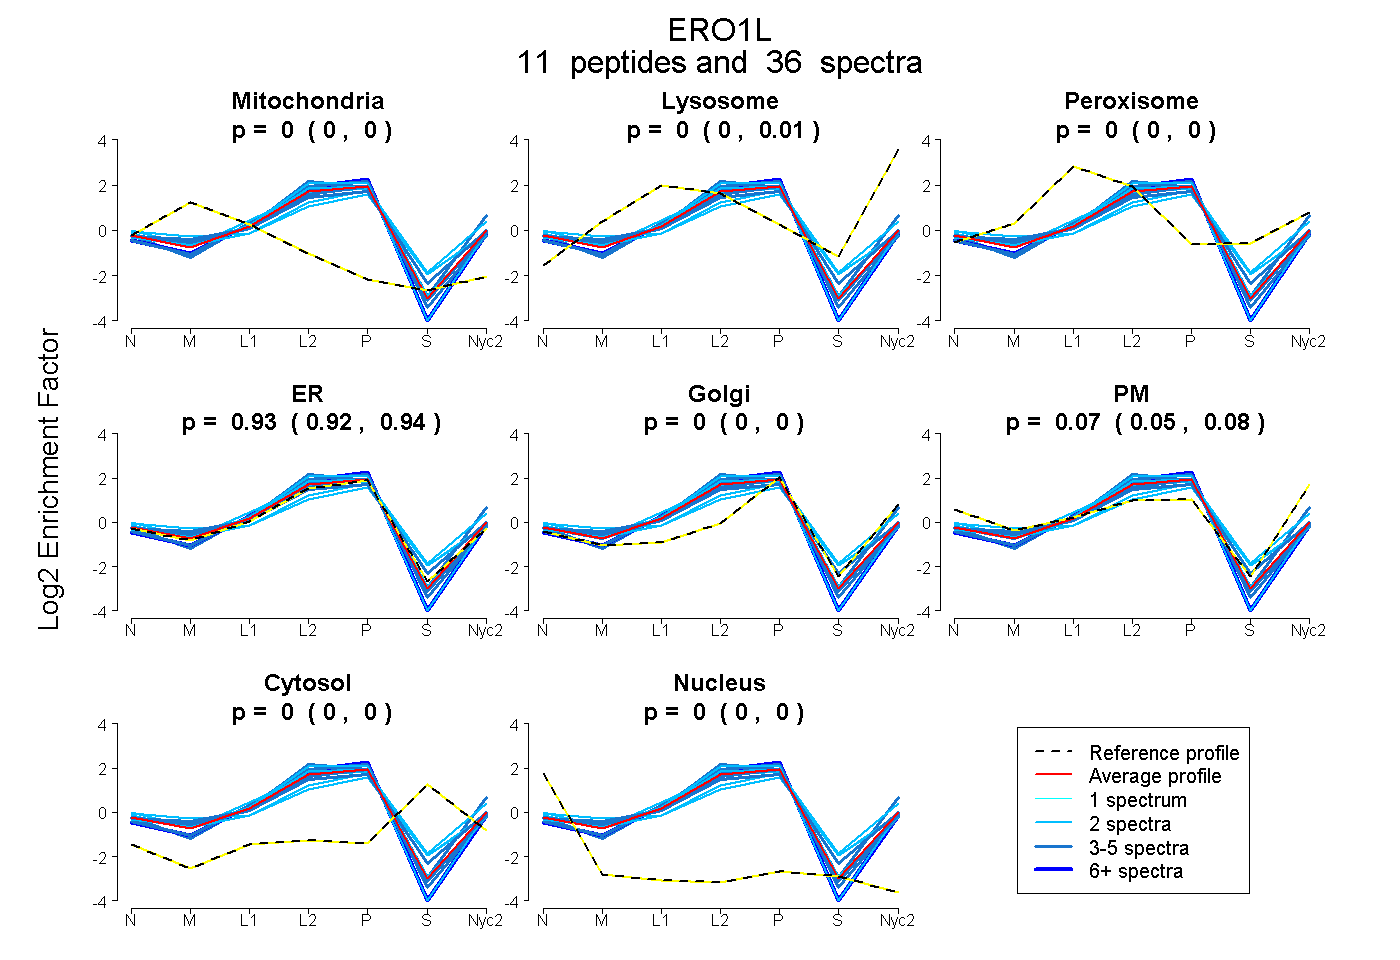
0.000 | 0.000
0.000 | 0.012
0.000 | 0.000
0.918 | 0.939
0.000 | 0.000
0.050 | 0.077
0.000 | 0.000
0.000 | 0.000
| Plot | Mito | Lyso | Perox | ER | Golgi | PM | Cytosol | Nucleus | |||||
| Expt A |
11 peptides |
36 spectra |
|
0.000 0.000 | 0.000 |
0.004 0.000 | 0.012 |
0.000 0.000 | 0.000 |
0.929 0.918 | 0.939 |
0.000 0.000 | 0.000 |
0.066 0.050 | 0.077 |
0.000 0.000 | 0.000 |
0.000 0.000 | 0.000 |
| 4 spectra, FDGVLTEGEGPR | 0.000 | 0.087 | 0.000 | 0.785 | 0.000 | 0.128 | 0.000 | 0.000 | ||
| 3 spectra, VLPFFERPDFQLFTGNK | 0.021 | 0.041 | 0.042 | 0.805 | 0.041 | 0.050 | 0.000 | 0.000 | ||
| 4 spectra, AVLQWTK | 0.000 | 0.000 | 0.000 | 1.000 | 0.000 | 0.000 | 0.000 | 0.000 | ||
| 2 spectra, QEIVSLFNAFGR | 0.000 | 0.009 | 0.000 | 0.986 | 0.000 | 0.005 | 0.000 | 0.000 | ||
| 2 spectra, LGAVDESLSEETQK | 0.057 | 0.000 | 0.056 | 0.608 | 0.151 | 0.090 | 0.039 | 0.000 | ||
| 3 spectra, ELLLEILHEVK | 0.000 | 0.000 | 0.000 | 1.000 | 0.000 | 0.000 | 0.000 | 0.000 | ||
| 2 spectra, LQTQGLGTALK | 0.000 | 0.000 | 0.000 | 1.000 | 0.000 | 0.000 | 0.000 | 0.000 | ||
| 8 spectra, ELENFR | 0.000 | 0.000 | 0.000 | 1.000 | 0.000 | 0.000 | 0.000 | 0.000 | ||
| 2 spectra, HLLQNVH | 0.000 | 0.096 | 0.072 | 0.752 | 0.000 | 0.071 | 0.009 | 0.000 | ||
| 2 spectra, GPDAWR | 0.000 | 0.000 | 0.000 | 0.790 | 0.000 | 0.122 | 0.087 | 0.000 | ||
| 4 spectra, VQDVENK | 0.000 | 0.000 | 0.000 | 0.940 | 0.000 | 0.060 | 0.000 | 0.000 |
| Plot | Mito | Lyso or Perox | ER | Golgi | PM | Cytosol | Nucleus | ||||||
| Expt B |
9 peptides |
19 spectra |
 |
0.000 0.000 | 0.000 |
0.066 0.052 | 0.078 |
0.922 0.894 | 0.939 |
0.000 0.000 | 0.014 |
0.000 0.000 | 0.000 |
0.013 0.002 | 0.021 |
0.000 0.000 | 0.000 |
|||
| Plot | Lyso | Other | |||||||||||
| Expt C |
15 peptides |
69 spectra |
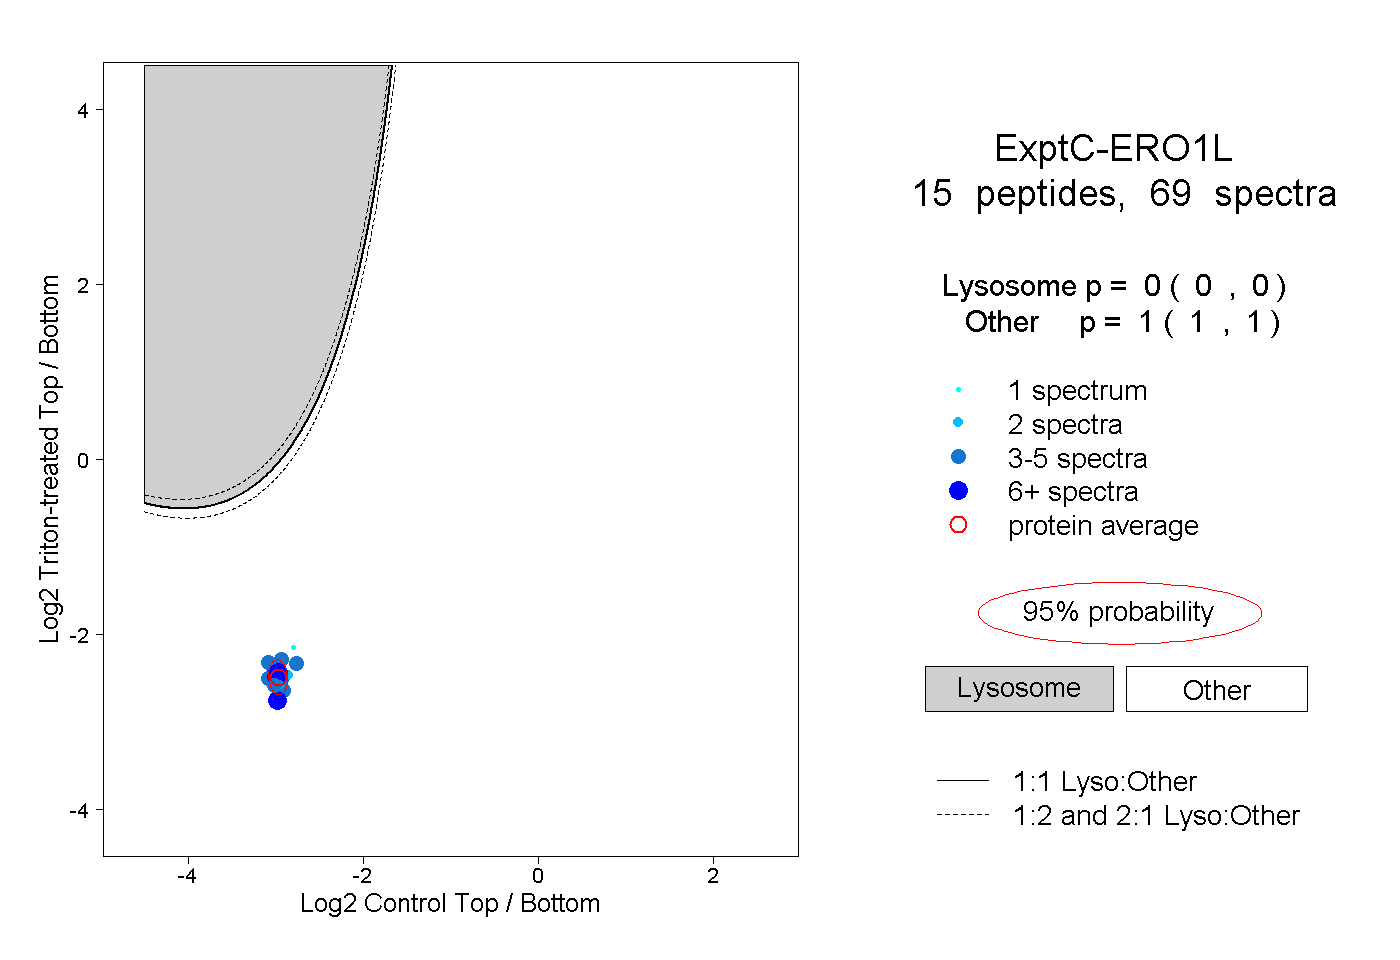 |
0.000 0.000 | 0.000 |
1.000 1.000 | 1.000 |
||||||||
| Plot | Lyso | Other | |||||||||||
| Expt D |
5 peptides |
10 spectra |
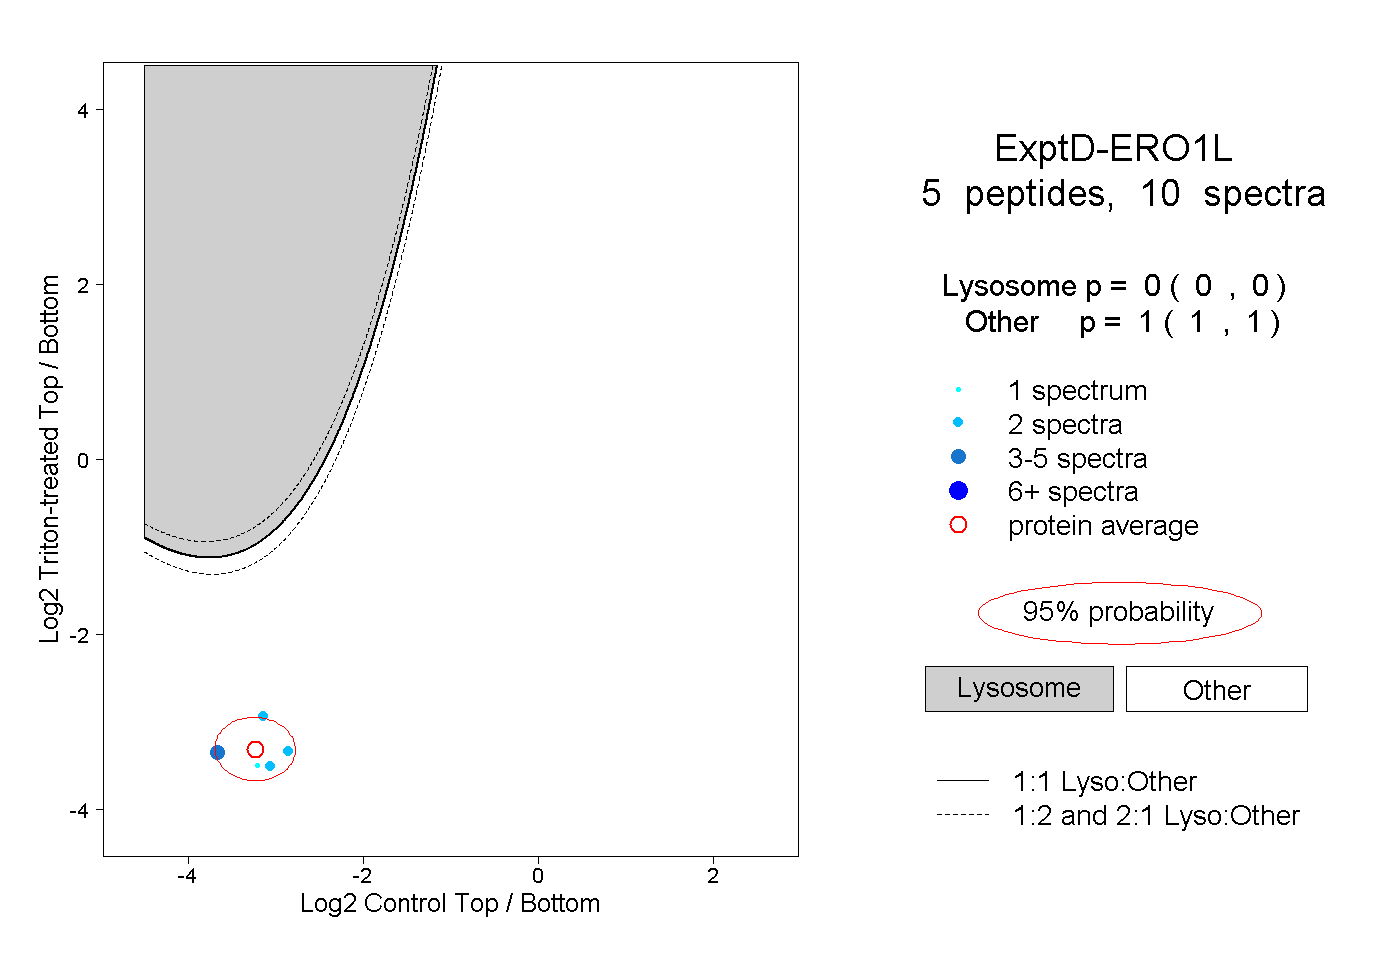 |
0.000 0.000 | 0.000 |
1.000 1.000 | 1.000 |