 145
145peptides
spectra
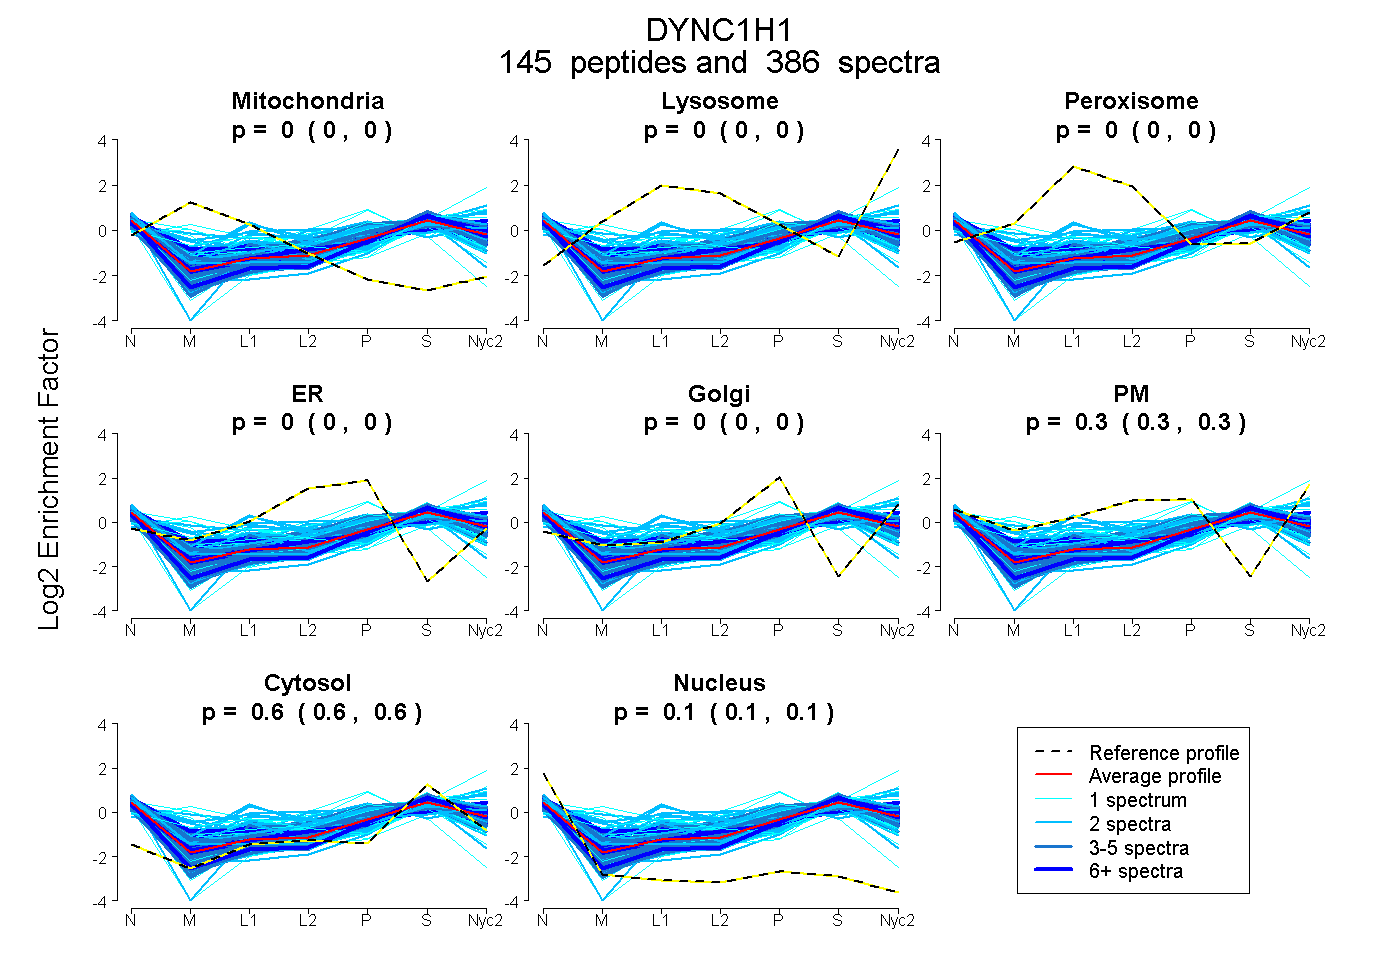
0.000 | 0.000
0.000 | 0.000
0.000 | 0.000
0.000 | 0.000
0.000 | 0.000
0.299 | 0.300
0.604 | 0.605
0.095 | 0.096
56peptides
spectra
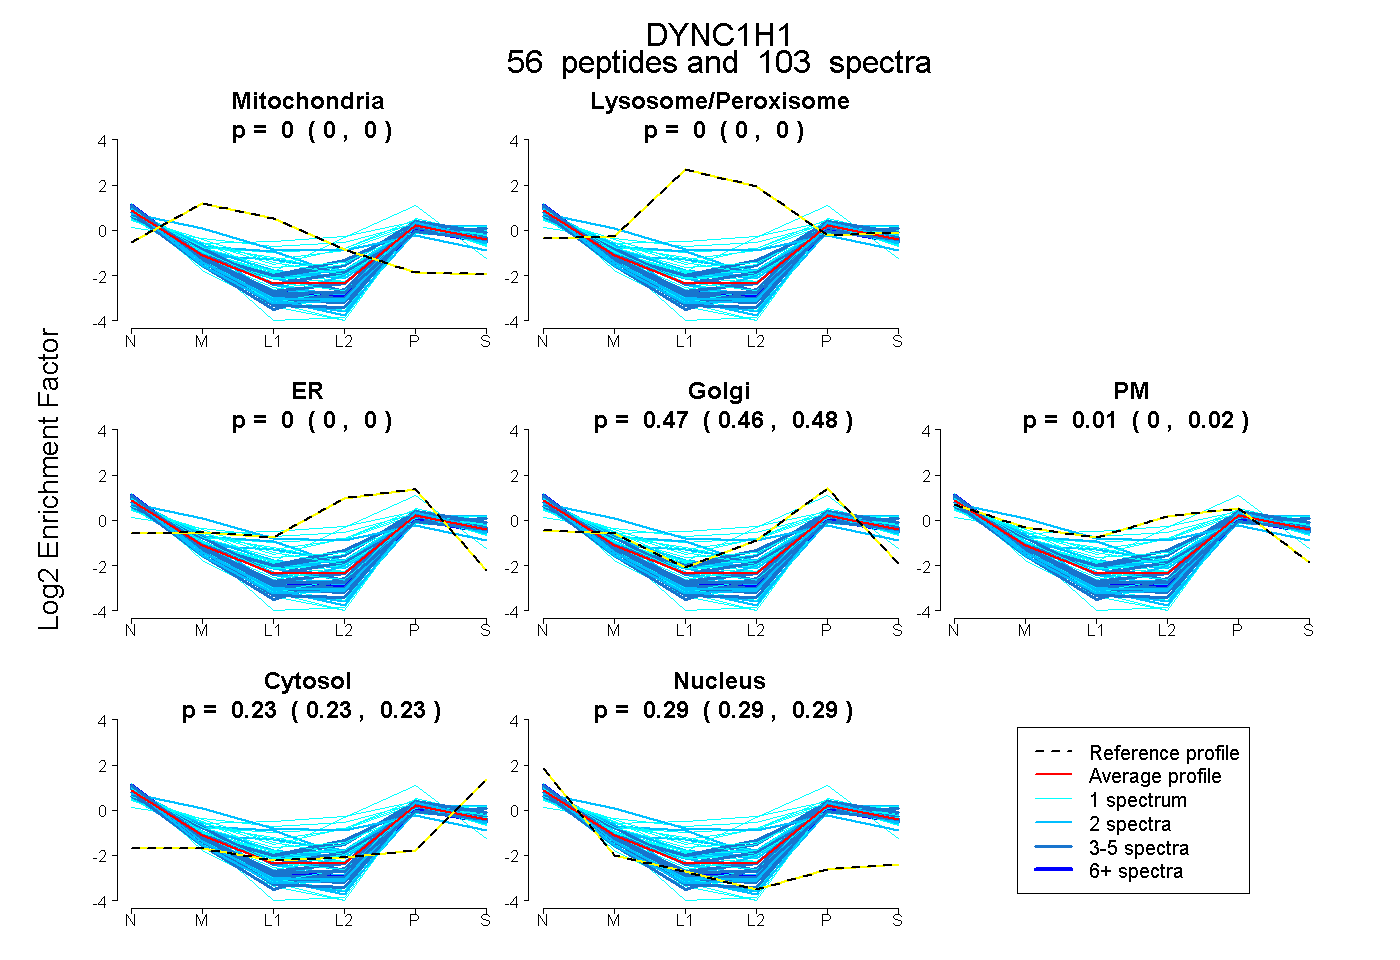
0.000 | 0.000
0.000 | 0.000
0.000 | 0.000
0.464 | 0.477
0.003 | 0.019
0.228 | 0.230
0.286 | 0.291
103peptides
spectra
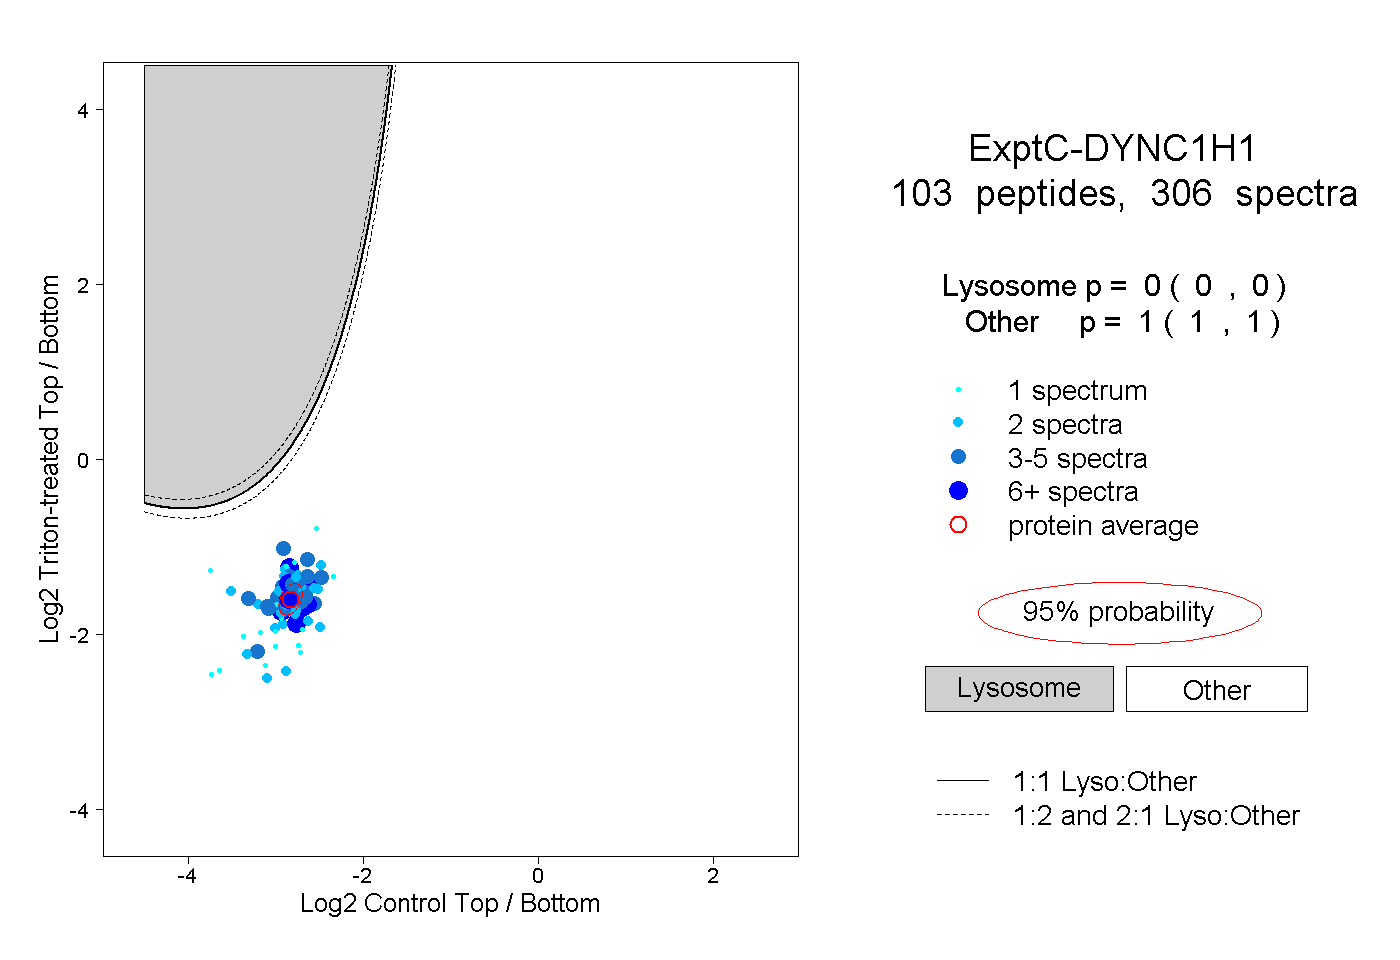
0.000 | 0.000
1.000 | 1.000
24peptides
spectra
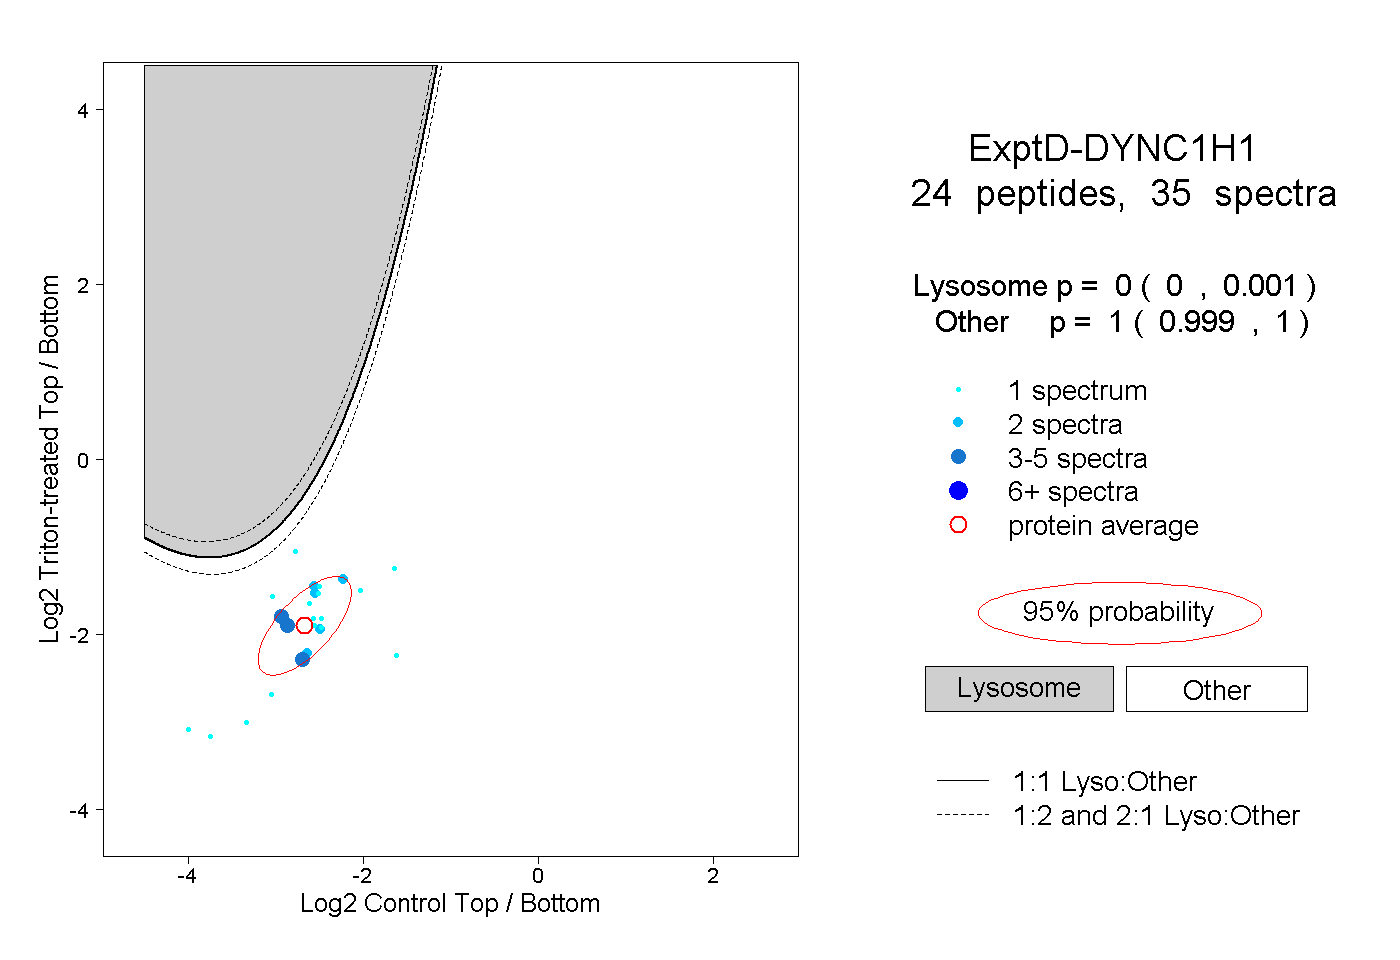
0.000 | 0.001
0.999 | 1.000