 6
6peptides
spectra
0.000 | 0.000
0.000 | 0.000
0.000 | 0.000
0.138 | 0.191
0.000 | 0.026
0.256 | 0.300
0.518 | 0.531
0.012 | 0.024
| Plot | Mito | Lyso | Perox | ER | Golgi | PM | Cytosol | Nucleus | |||||
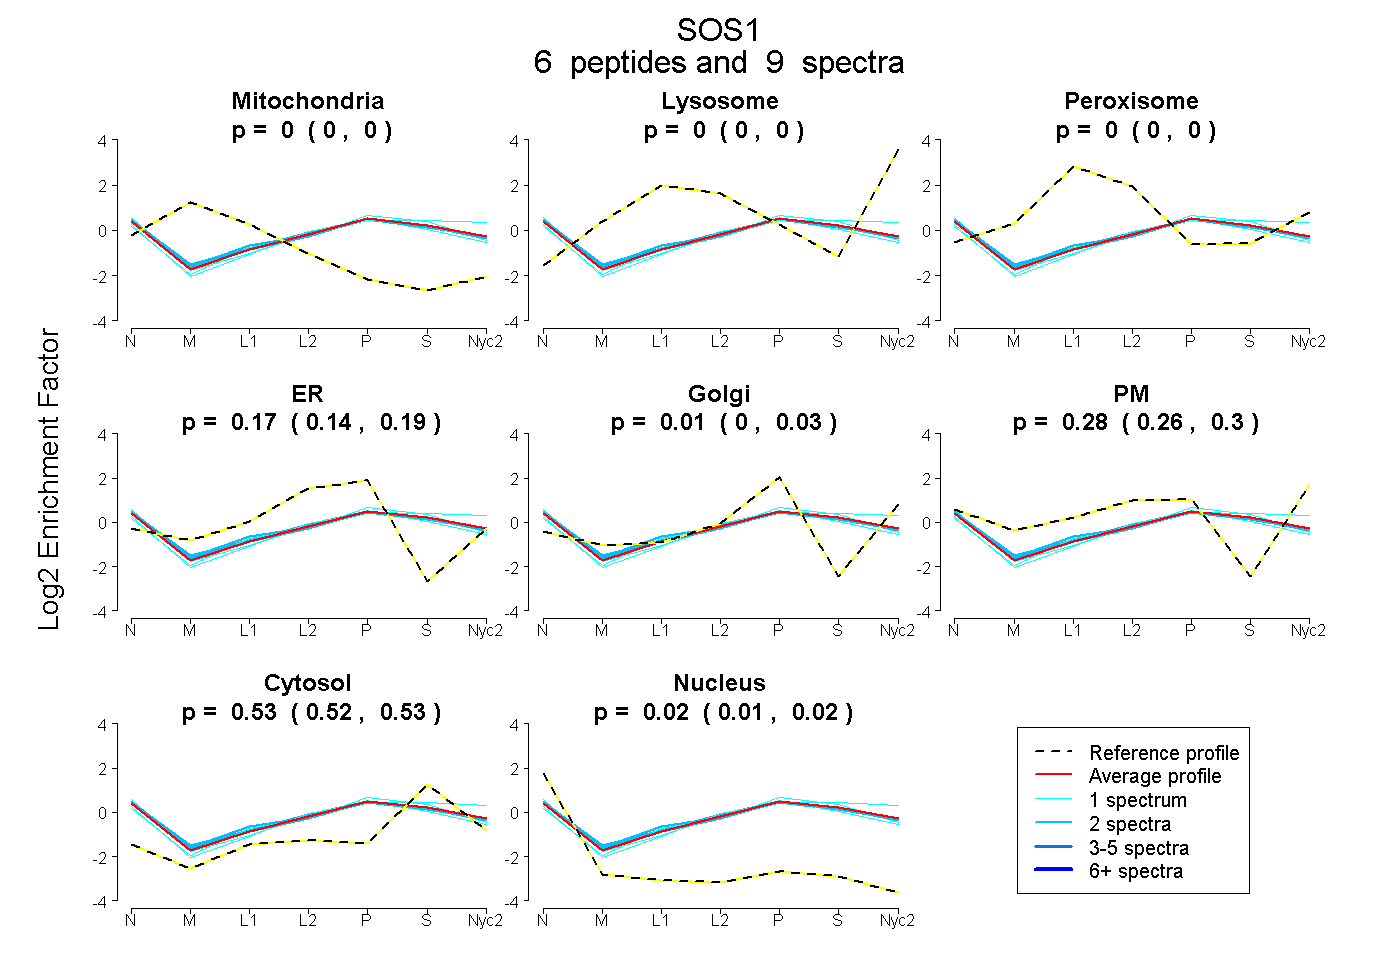
| Expt A |
6 peptides |
9 spectra |
|
0.000 0.000 | 0.000 |
0.000 0.000 | 0.000 |
0.000 0.000 | 0.000 |
0.167 0.138 | 0.191 |
0.008 0.000 | 0.026 |
0.281 0.256 | 0.300 |
0.525 0.518 | 0.531 |
0.019 0.012 | 0.024 |
| 2 spectra, VAVVSR | 0.000 | 0.000 | 0.000 | 0.165 | 0.023 | 0.267 | 0.513 | 0.032 | ||
| 2 spectra, EYIQPVQLR | 0.000 | 0.000 | 0.000 | 0.159 | 0.000 | 0.311 | 0.505 | 0.025 | ||
| 1 spectrum, LPSADVYR | 0.000 | 0.000 | 0.000 | 0.249 | 0.058 | 0.126 | 0.567 | 0.000 | ||
| 2 spectra, IHHLLR | 0.000 | 0.000 | 0.000 | 0.173 | 0.000 | 0.310 | 0.496 | 0.021 | ||
| 1 spectrum, TEEGNPEVLR | 0.000 | 0.000 | 0.000 | 0.000 | 0.078 | 0.366 | 0.555 | 0.000 | ||
| 1 spectrum, FEIPEPEPTEADR | 0.000 | 0.000 | 0.000 | 0.237 | 0.008 | 0.210 | 0.478 | 0.067 |
| Plot | Mito | Lyso or Perox | ER | Golgi | PM | Cytosol | Nucleus | ||||||
| Expt B |
5 peptides |
6 spectra |
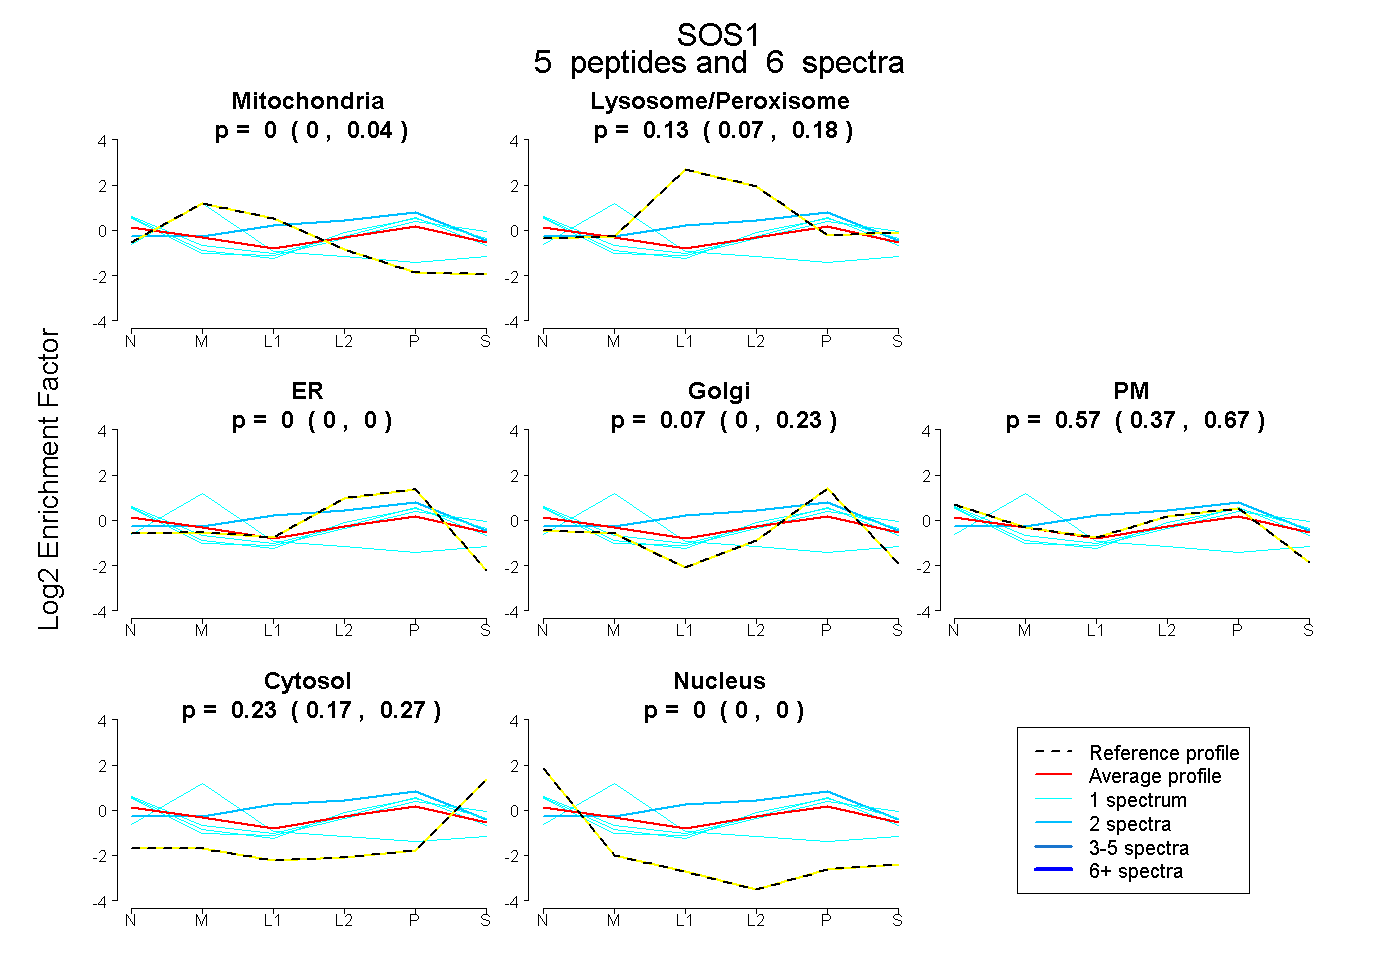 |
0.000 0.000 | 0.039 |
0.127 0.068 | 0.183 |
0.000 0.000 | 0.000 |
0.069 0.000 | 0.229 |
0.571 0.372 | 0.666 |
0.234 0.173 | 0.275 |
0.000 0.000 | 0.000 |
|||
| Plot | Lyso | Other | |||||||||||
| Expt C |
5 peptides |
7 spectra |
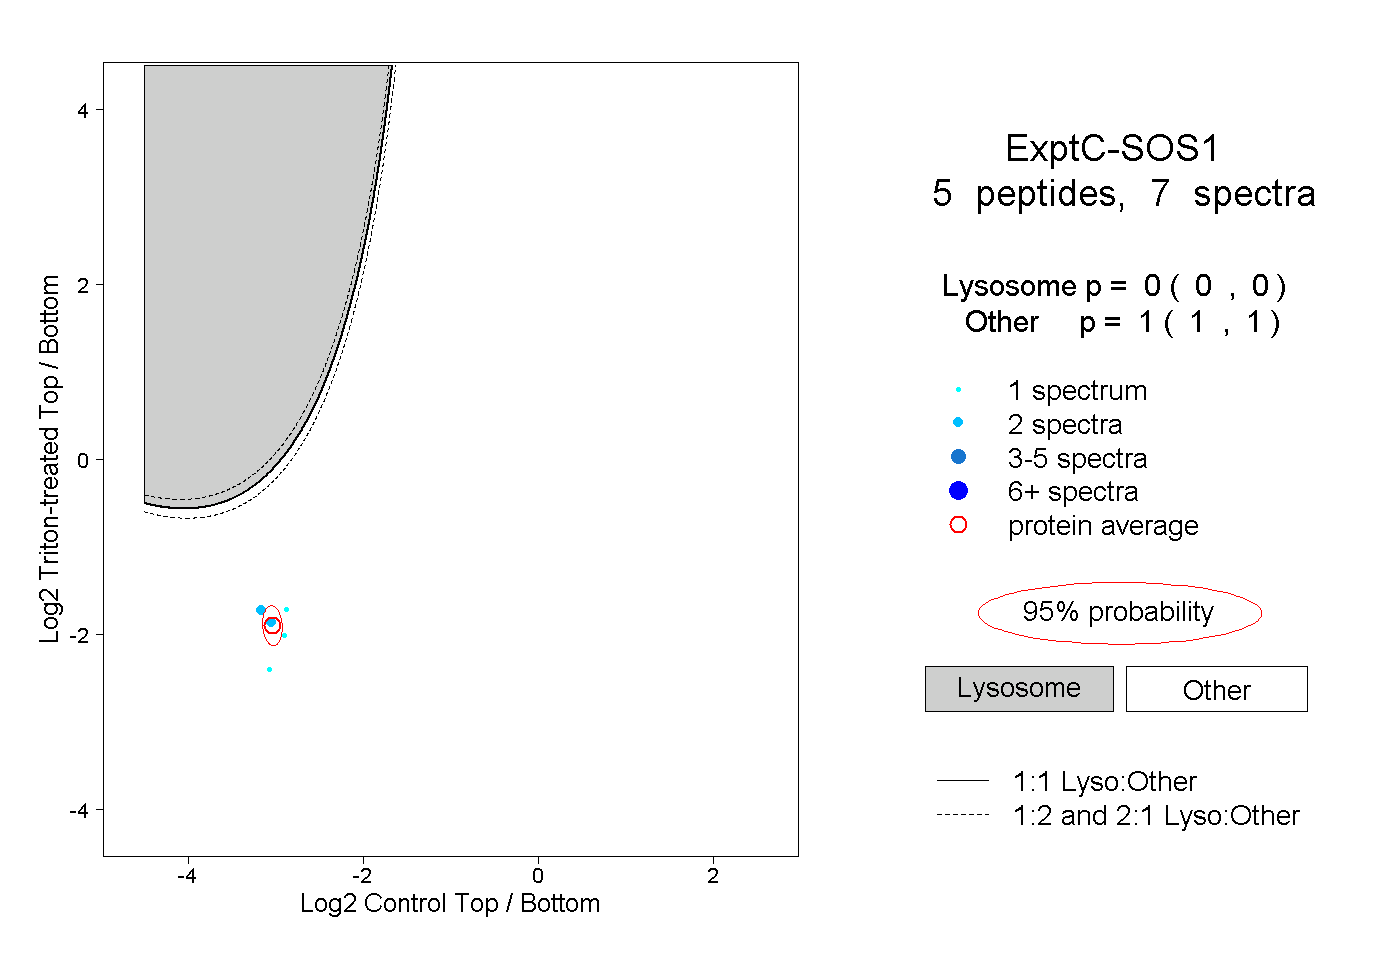 |
0.000 0.000 | 0.000 |
1.000 1.000 | 1.000 |
||||||||
| Plot | Lyso | Other | |||||||||||
| Expt D |
1 peptide |
1 spectrum |
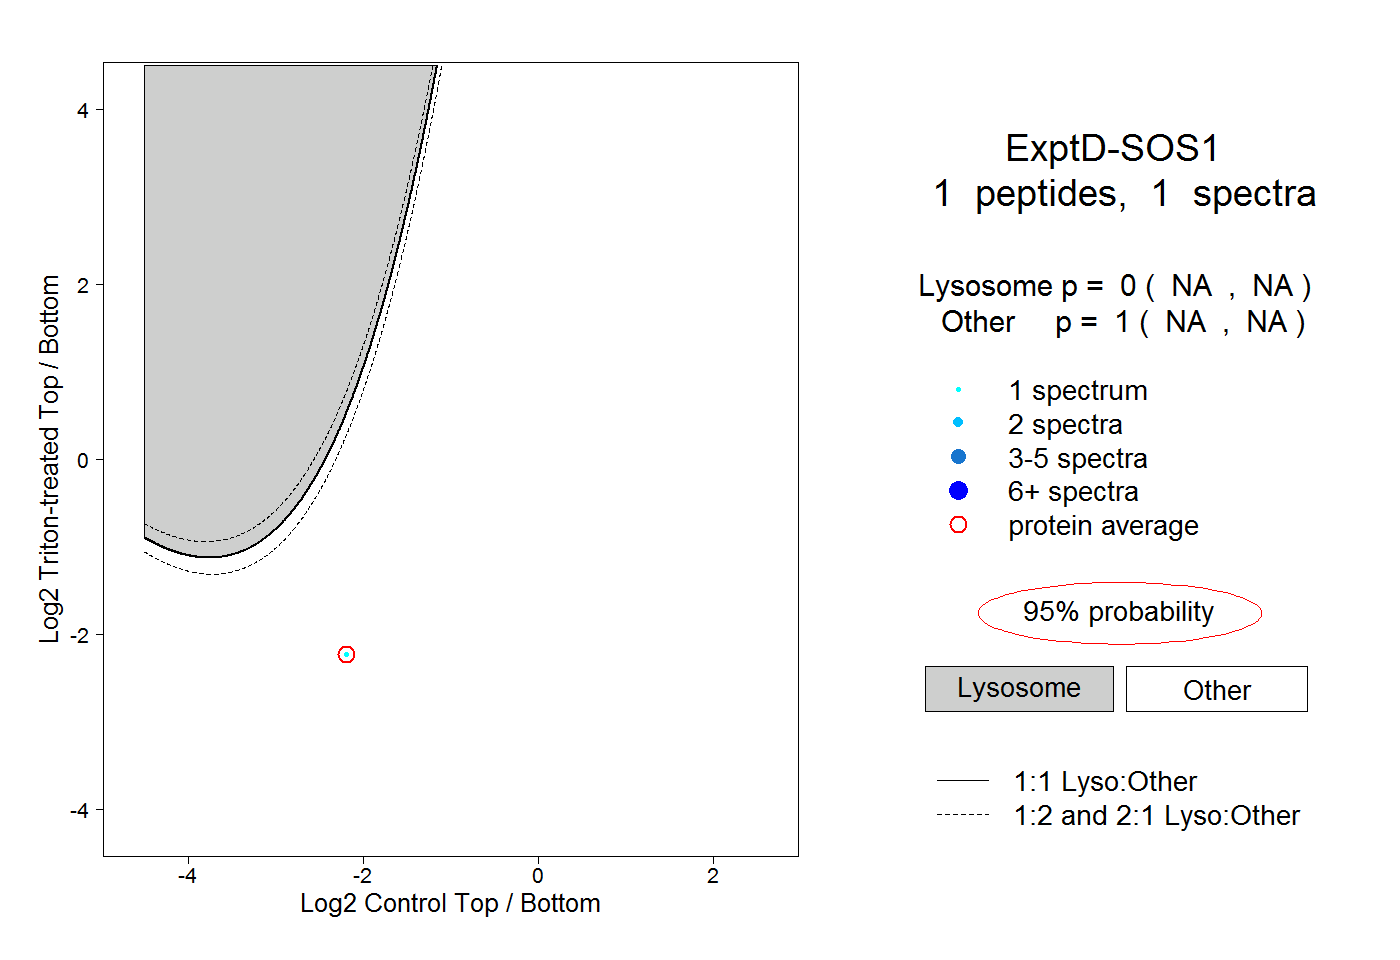 |
0.000 NA | NA |
1.000 NA | NA |