 1
1peptide
spectra
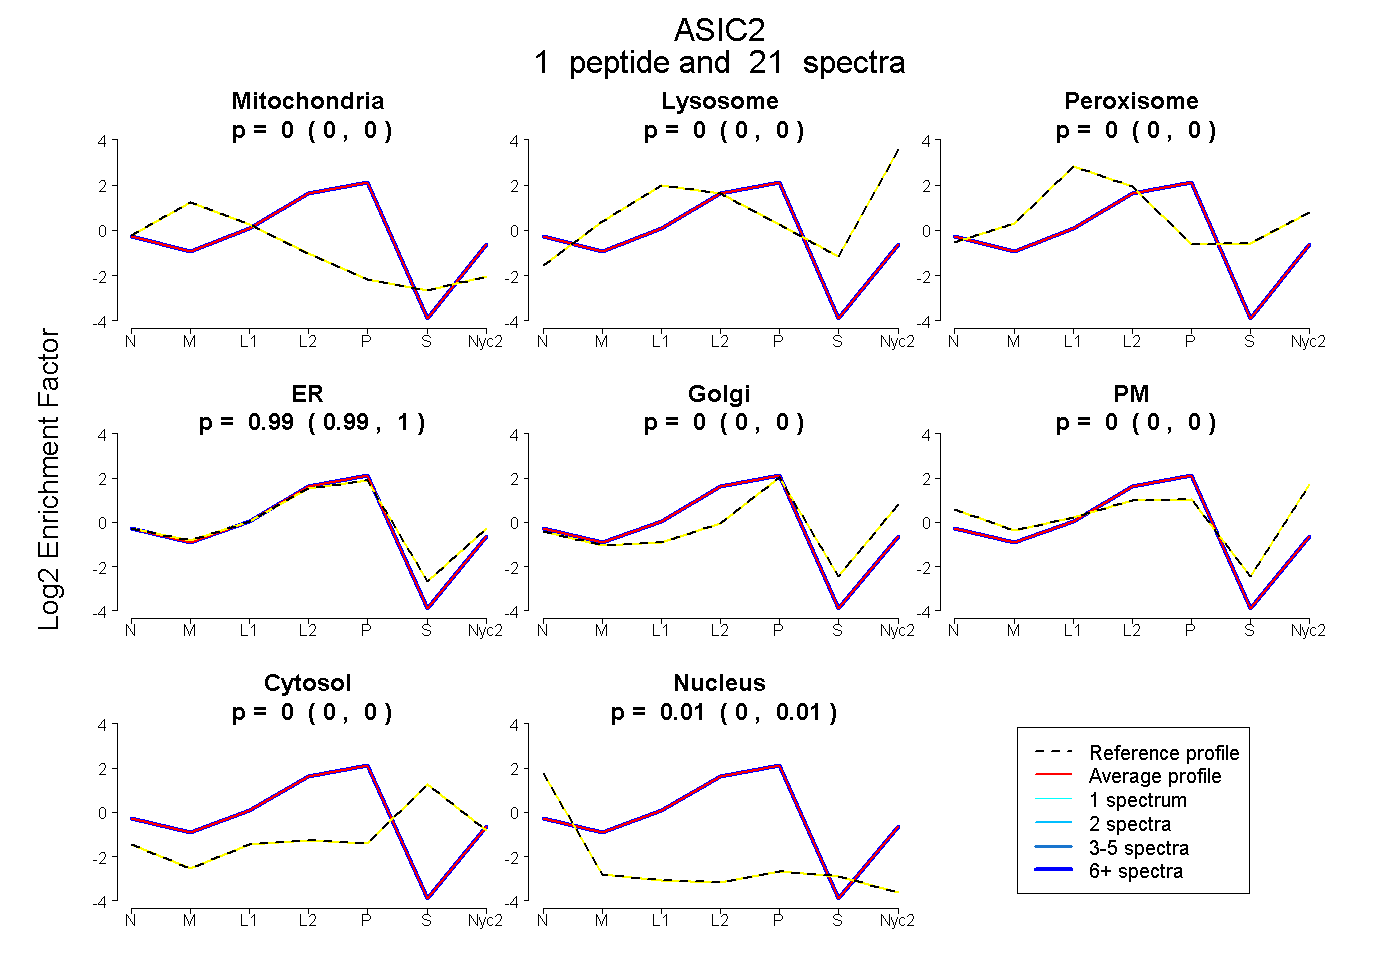
0.000 | 0.000
0.000 | 0.000
0.000 | 0.000
0.990 | 0.996
0.000 | 0.000
0.000 | 0.000
0.000 | 0.000
0.004 | 0.009
1peptide
spectra
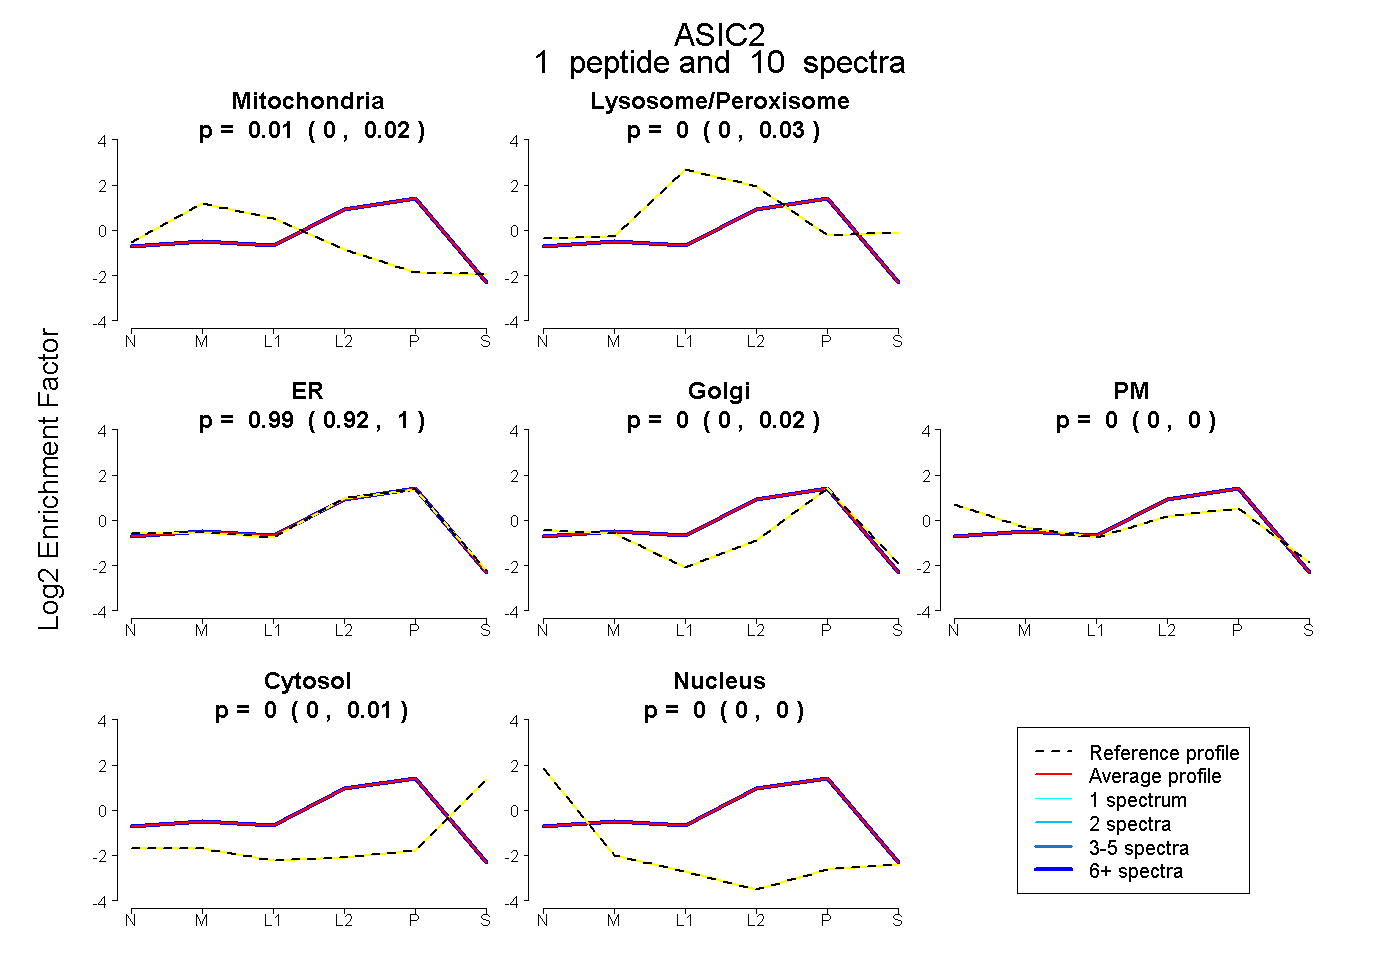
0.000 | 0.019
0.000 | 0.034
0.920 | 1.000
0.000 | 0.024
0.000 | 0.000
0.000 | 0.012
0.000 | 0.000
1peptide
spectra
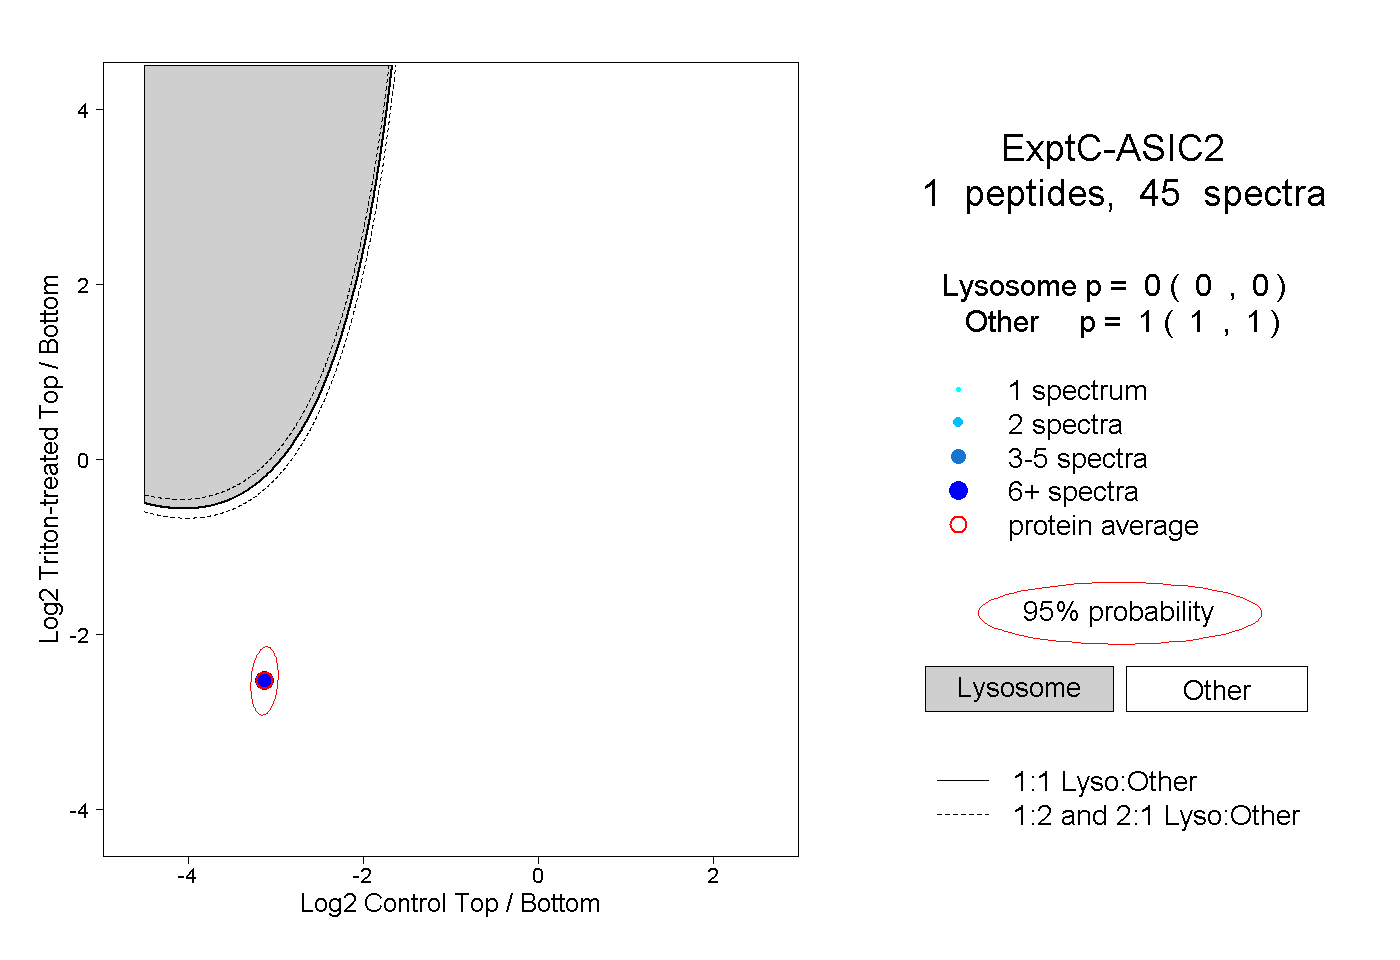
0.000 | 0.000
1.000 | 1.000
1peptide
spectra
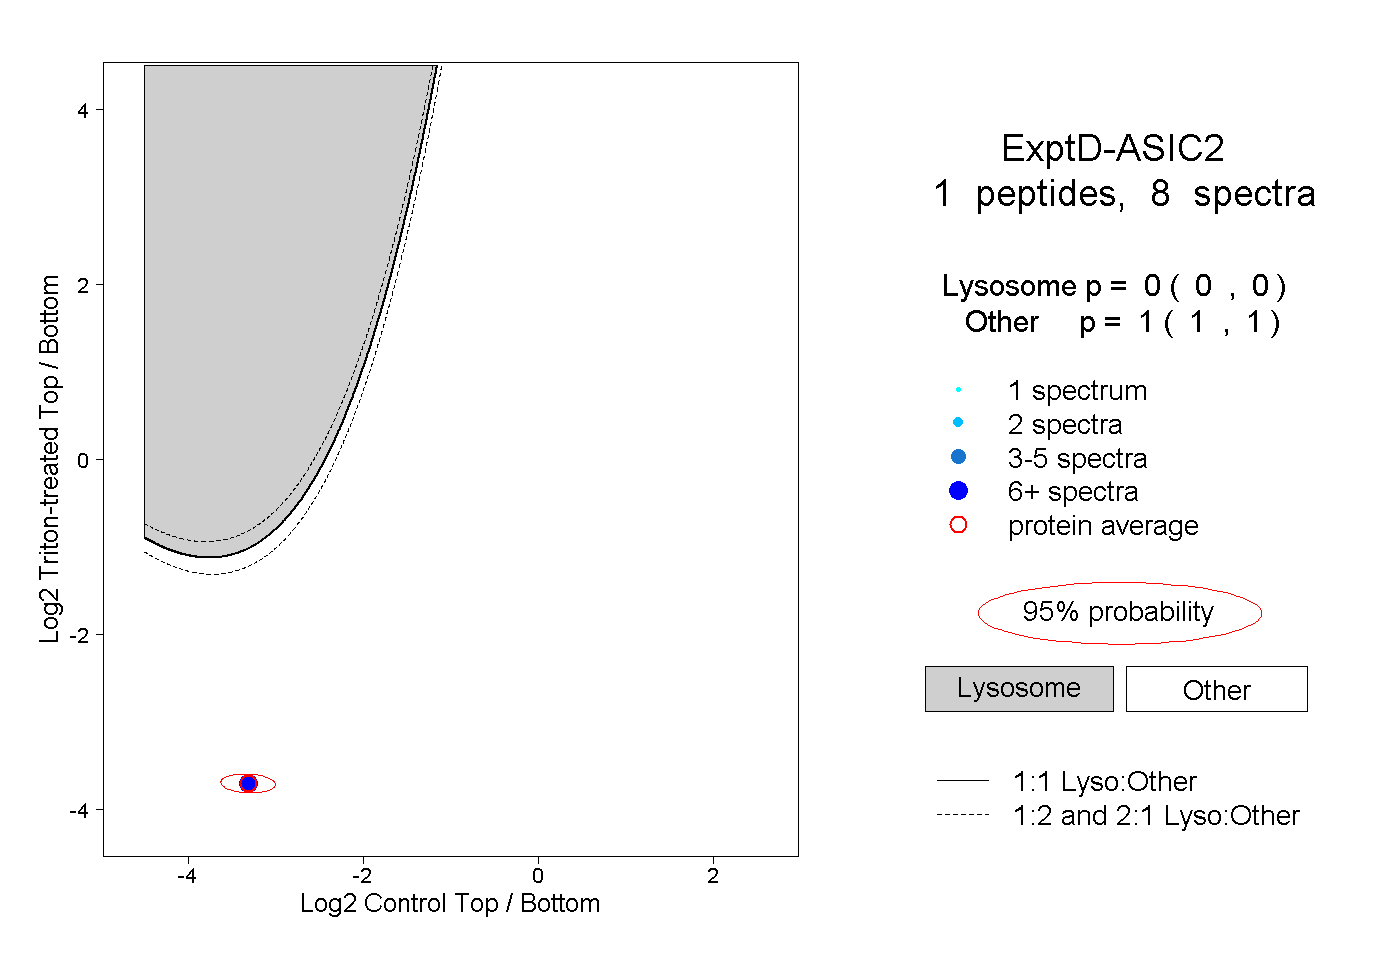
0.000 | 0.000
1.000 | 1.000