7
7peptides
spectra
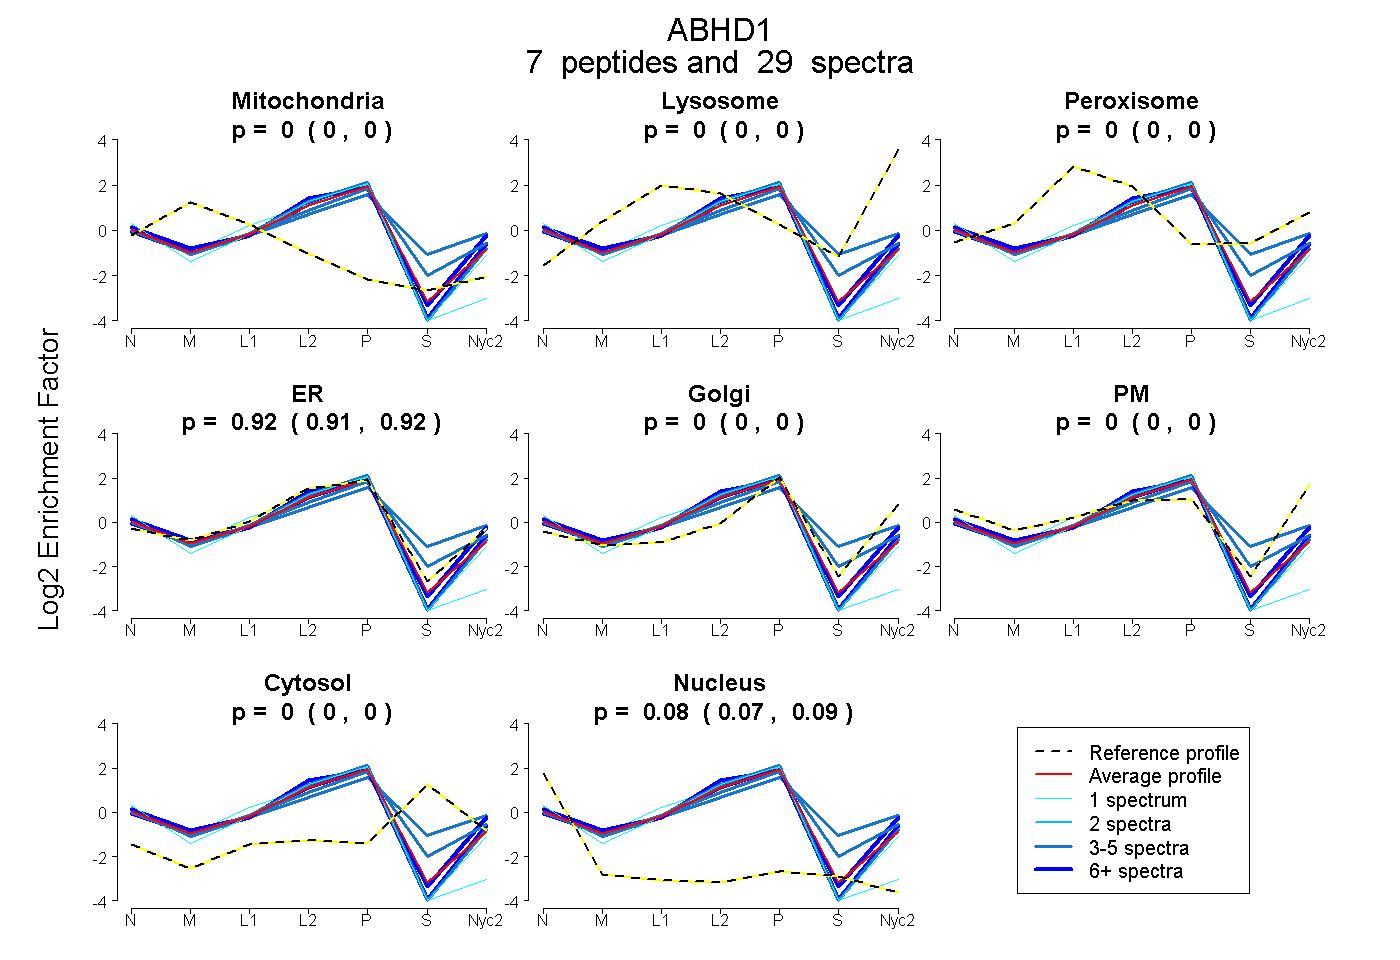
0.000 | 0.000
0.000 | 0.000
0.000 | 0.000
0.913 | 0.925
0.000 | 0.000
0.000 | 0.000
0.000 | 0.000
0.074 | 0.086
5peptides
spectra
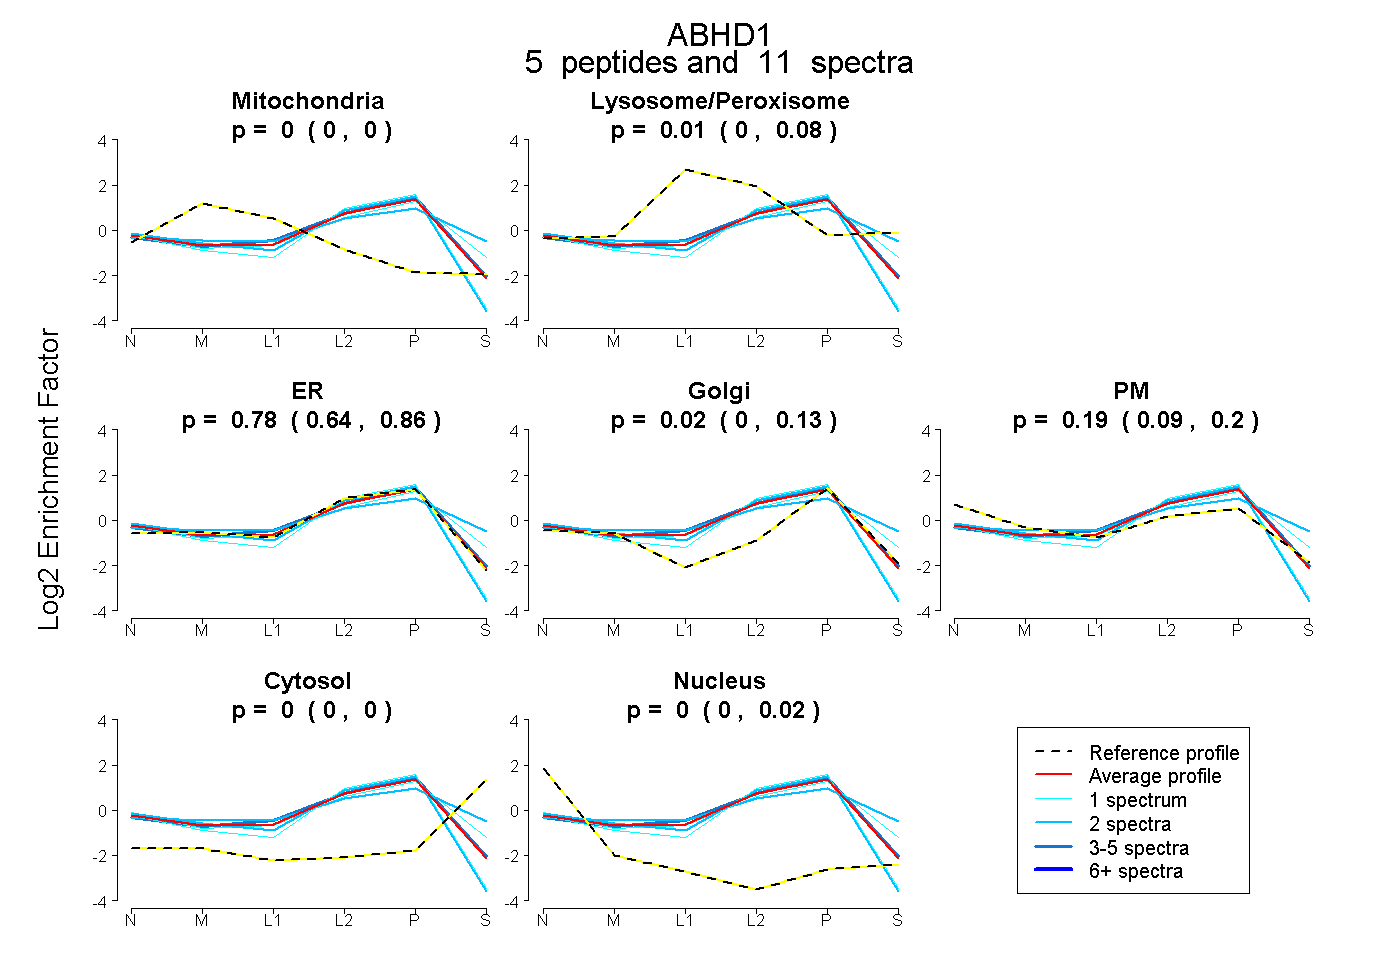
0.000 | 0.000
0.000 | 0.082
0.640 | 0.864
0.000 | 0.128
0.090 | 0.199
0.000 | 0.000
0.000 | 0.020