 7
7peptides
spectra
0.000 | 0.000
0.000 | 0.000
0.000 | 0.000
0.913 | 0.925
0.000 | 0.000
0.000 | 0.000
0.000 | 0.000
0.074 | 0.086
| Plot | Mito | Lyso | Perox | ER | Golgi | PM | Cytosol | Nucleus | |||||
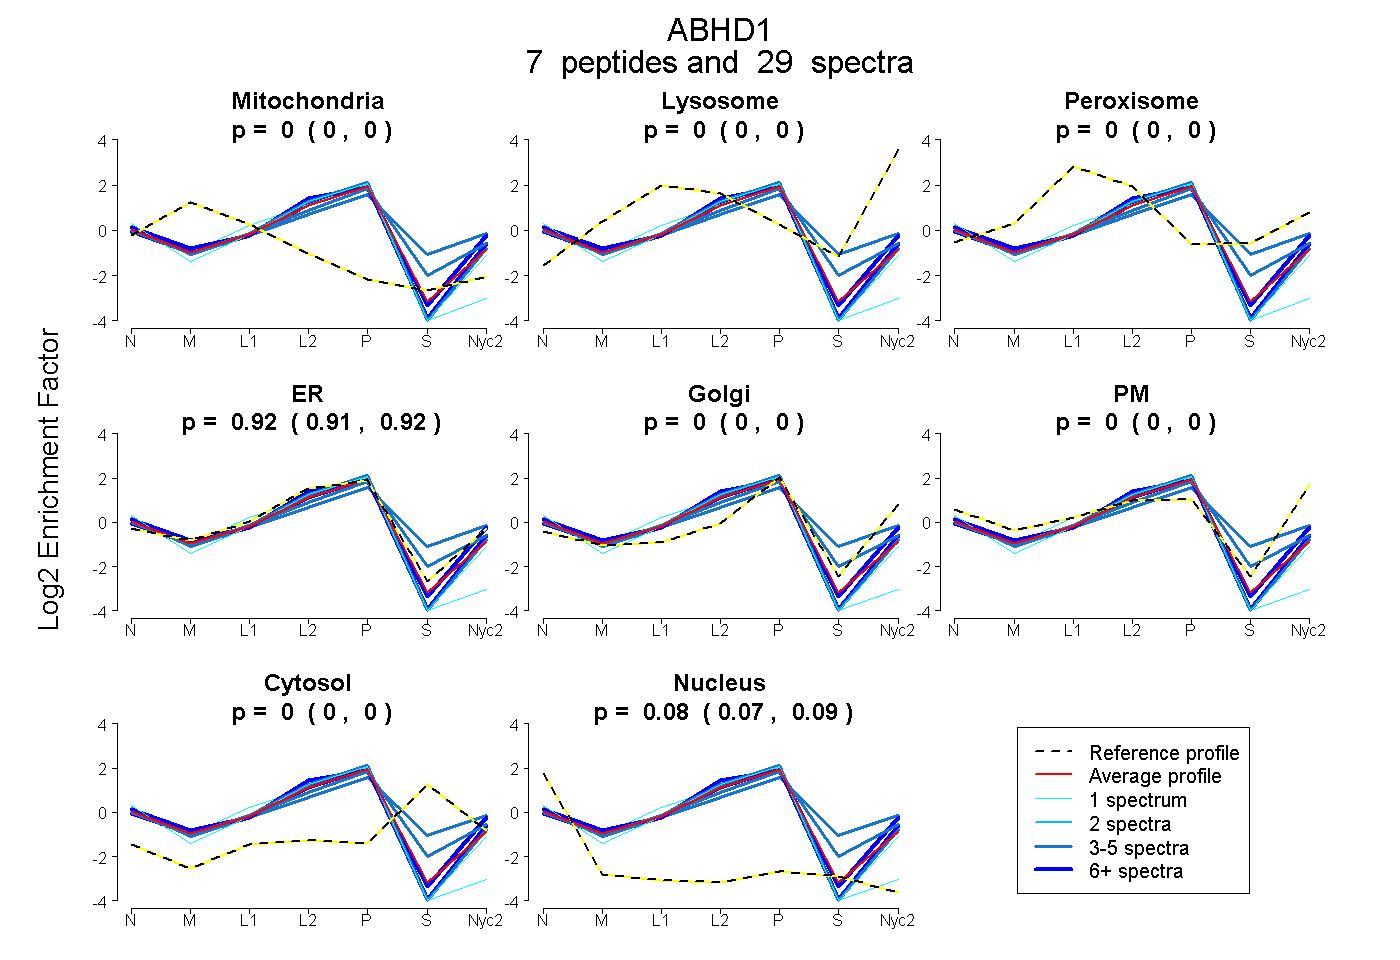
| Expt A |
7 peptides |
29 spectra |
|
0.000 0.000 | 0.000 |
0.000 0.000 | 0.000 |
0.000 0.000 | 0.000 |
0.920 0.913 | 0.925 |
0.000 0.000 | 0.000 |
0.000 0.000 | 0.000 |
0.000 0.000 | 0.000 |
0.080 0.074 | 0.086 |
| 6 spectra, LQTIFR | 0.000 | 0.000 | 0.000 | 0.907 | 0.000 | 0.062 | 0.000 | 0.031 | ||
| 1 spectrum, VLDVDFAIK | 0.000 | 0.000 | 0.000 | 0.905 | 0.000 | 0.000 | 0.000 | 0.095 | ||
| 3 spectra, GEELLTHR | 0.000 | 0.000 | 0.000 | 0.555 | 0.052 | 0.165 | 0.228 | 0.000 | ||
| 9 spectra, AVVFNNR | 0.000 | 0.000 | 0.000 | 0.937 | 0.000 | 0.000 | 0.000 | 0.063 | ||
| 5 spectra, VLHQYAR | 0.000 | 0.000 | 0.000 | 0.807 | 0.073 | 0.000 | 0.086 | 0.033 | ||
| 1 spectrum, AYCASNTEDLETVVK | 0.000 | 0.000 | 0.000 | 0.840 | 0.000 | 0.000 | 0.000 | 0.160 | ||
| 4 spectra, SPYVALLITAR | 0.000 | 0.000 | 0.000 | 0.943 | 0.000 | 0.000 | 0.000 | 0.057 |
| Plot | Mito | Lyso or Perox | ER | Golgi | PM | Cytosol | Nucleus | ||||||
| Expt B |
5 peptides |
11 spectra |
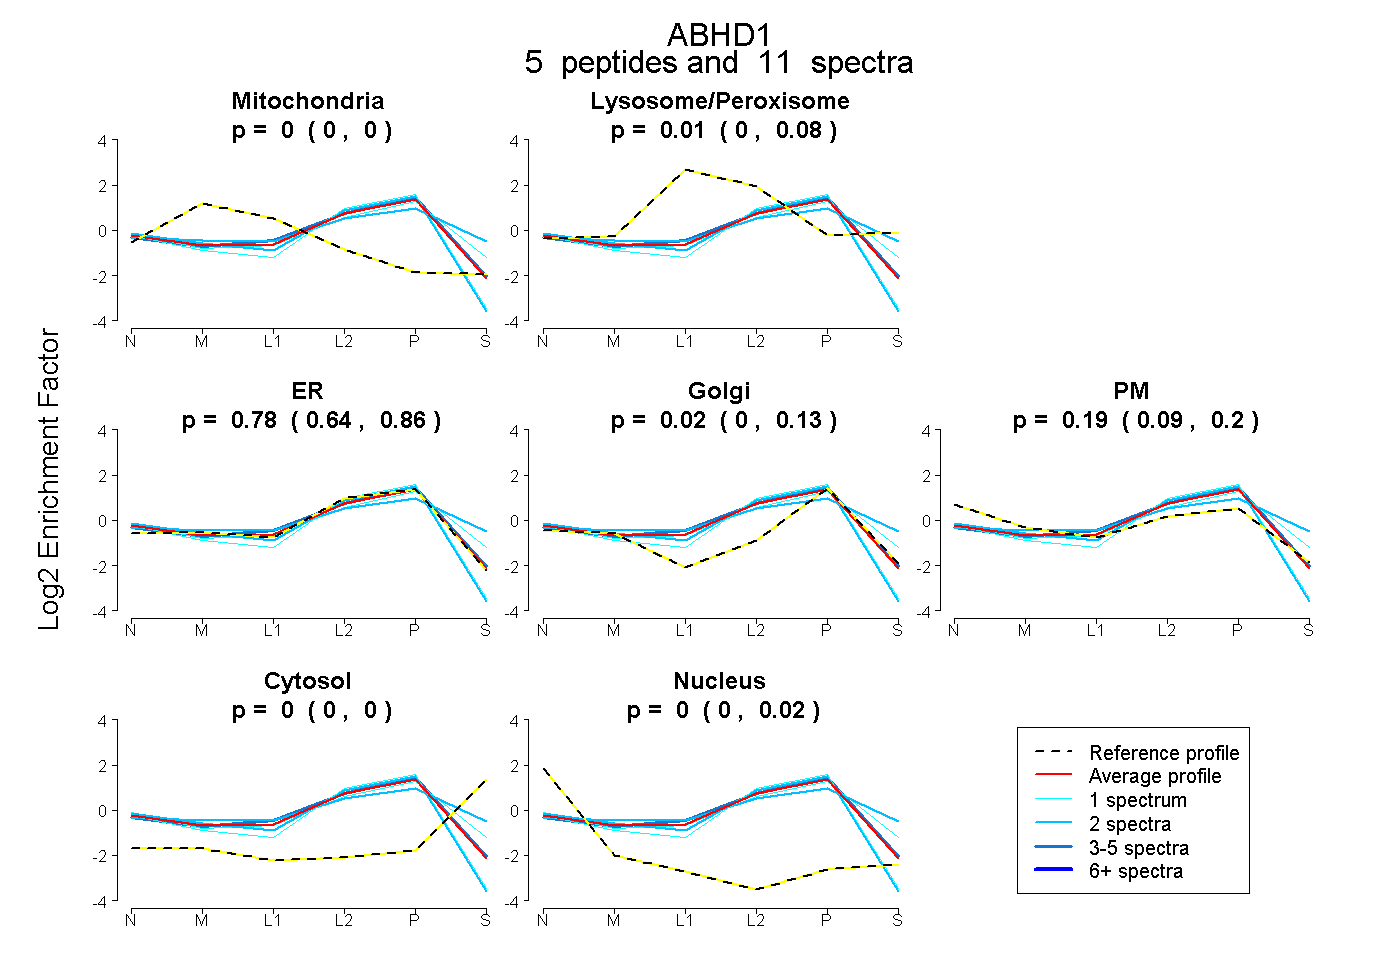 |
0.000 0.000 | 0.000 |
0.012 0.000 | 0.082 |
0.781 0.640 | 0.864 |
0.015 0.000 | 0.128 |
0.192 0.090 | 0.199 |
0.000 0.000 | 0.000 |
0.000 0.000 | 0.020 |
|||
| Plot | Lyso | Other | |||||||||||
| Expt C |
7 peptides |
20 spectra |
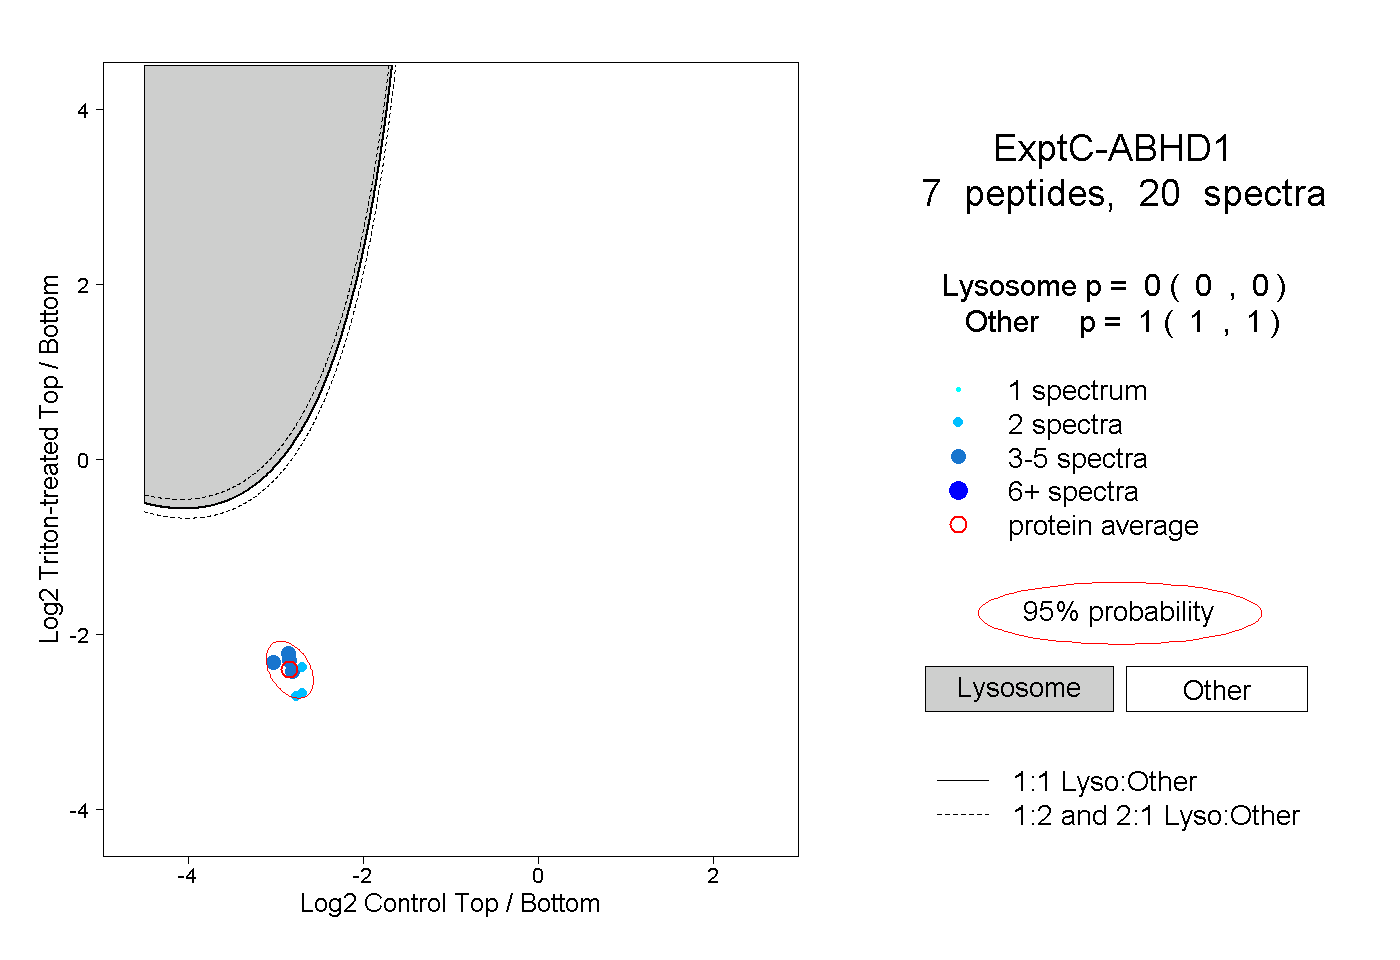 |
0.000 0.000 | 0.000 |
1.000 1.000 | 1.000 |
||||||||
| Plot | Lyso | Other | |||||||||||
| Expt D |
3 peptides |
7 spectra |
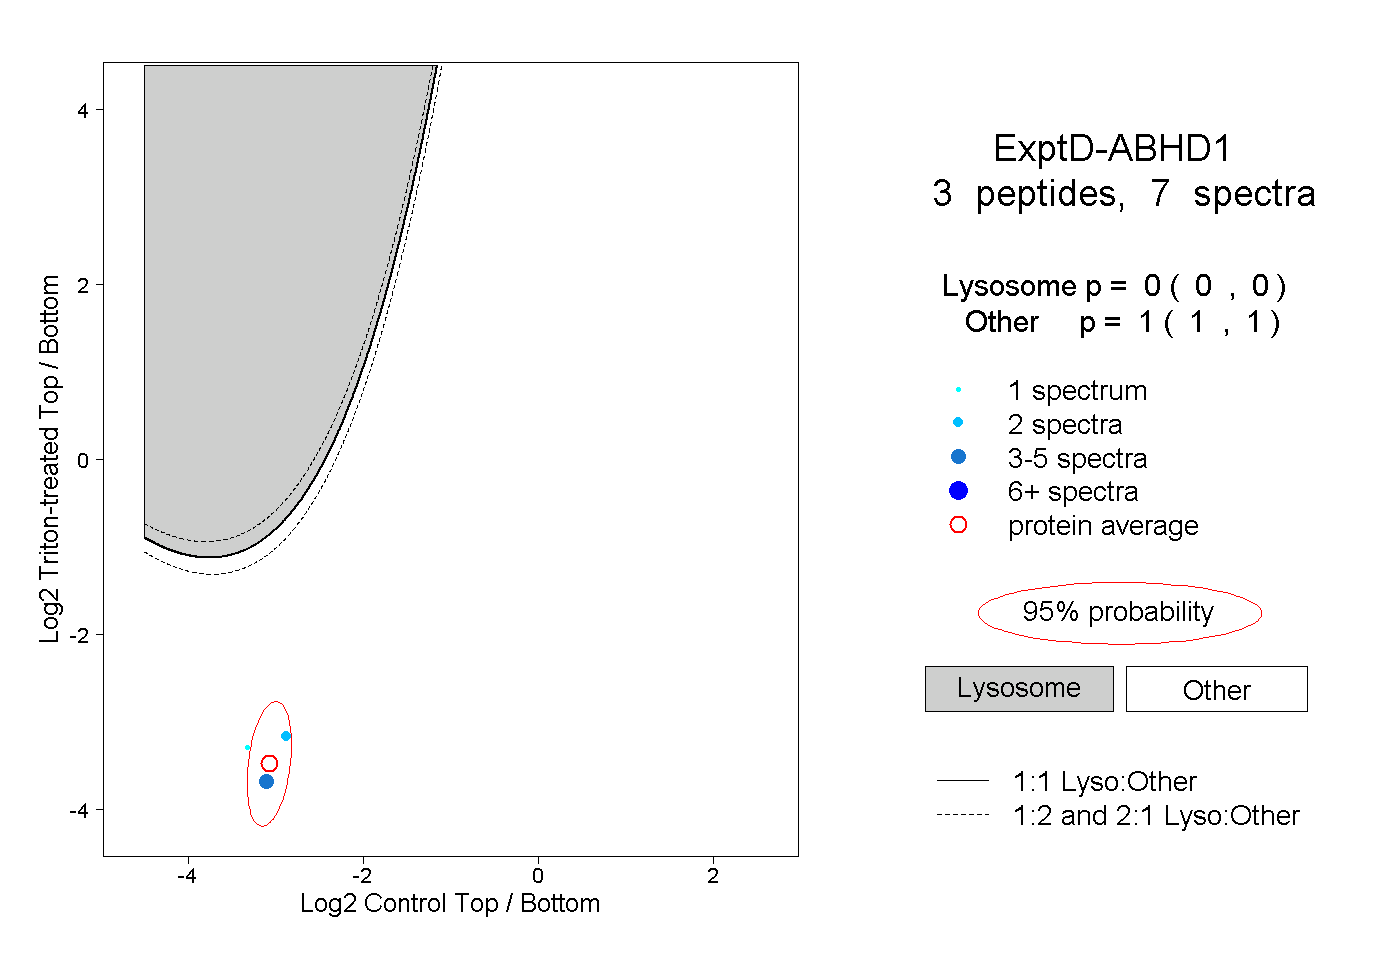 |
0.000 0.000 | 0.000 |
1.000 1.000 | 1.000 |