 7
7peptides
spectra
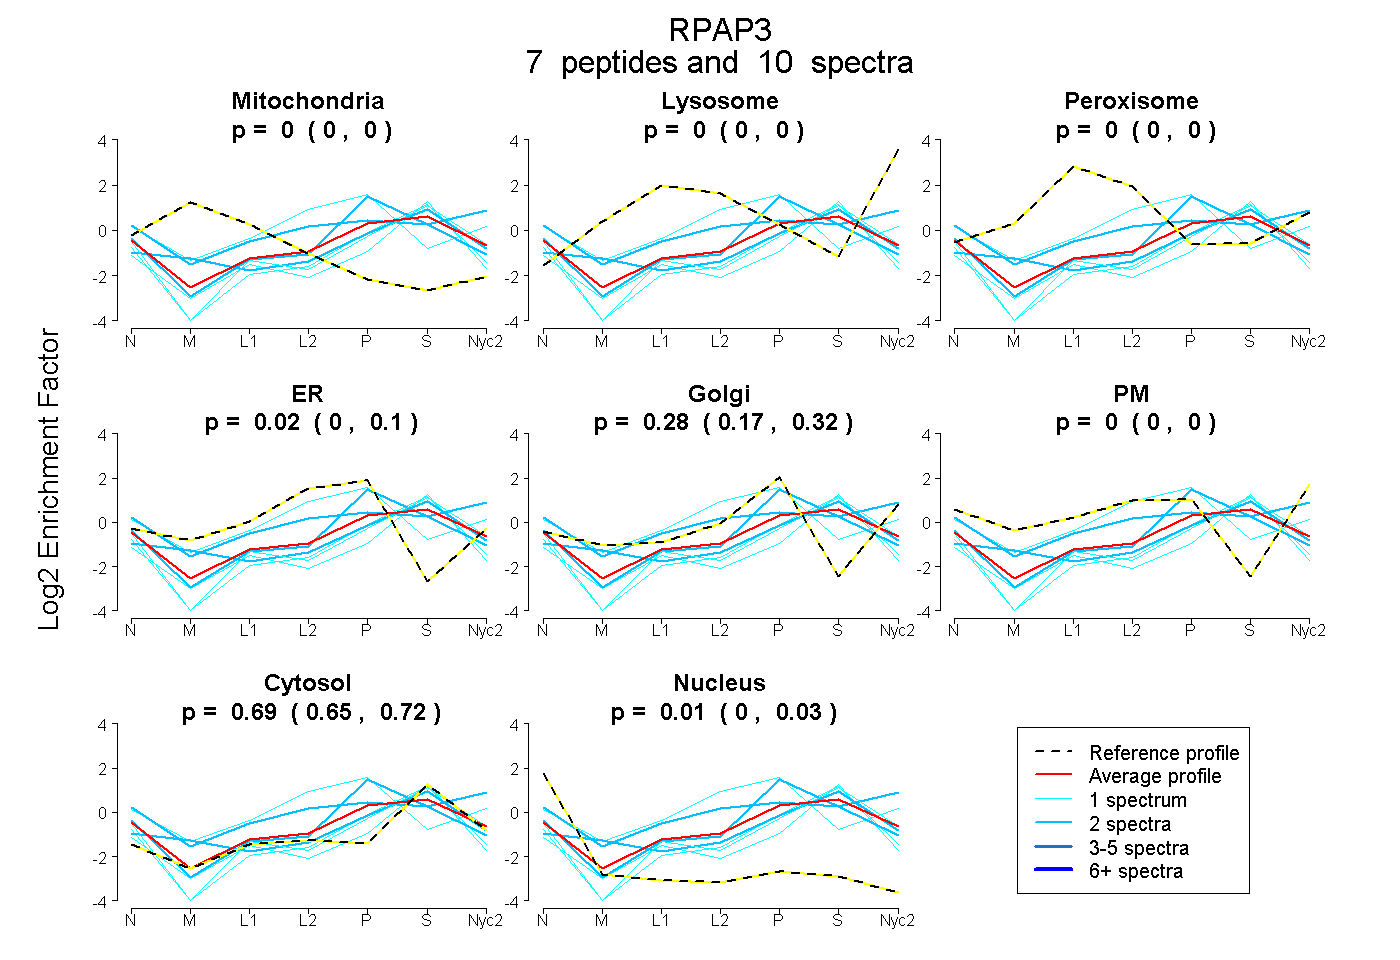
0.000 | 0.000
0.000 | 0.000
0.000 | 0.000
0.000 | 0.101
0.172 | 0.321
0.000 | 0.000
0.652 | 0.718
0.000 | 0.033
| Plot | Mito | Lyso | Perox | ER | Golgi | PM | Cytosol | Nucleus | |||||
| Expt A |
7 peptides |
10 spectra |
|
0.000 0.000 | 0.000 |
0.000 0.000 | 0.000 |
0.000 0.000 | 0.000 |
0.019 0.000 | 0.101 |
0.281 0.172 | 0.321 |
0.000 0.000 | 0.000 |
0.690 0.652 | 0.718 |
0.010 0.000 | 0.033 |
| 2 spectra, SFDYDAWAK | 0.000 | 0.034 | 0.000 | 0.000 | 0.000 | 0.500 | 0.467 | 0.000 | ||
| 1 spectrum, VLFNHLEK | 0.000 | 0.000 | 0.000 | 0.000 | 0.083 | 0.000 | 0.869 | 0.048 | ||
| 1 spectrum, HNAEELQDFMR | 0.000 | 0.000 | 0.000 | 0.502 | 0.021 | 0.225 | 0.253 | 0.000 | ||
| 1 spectrum, AAVAVDTGR | 0.000 | 0.000 | 0.000 | 0.000 | 0.000 | 0.000 | 0.893 | 0.107 | ||
| 1 spectrum, EKPALIFEVLER | 0.000 | 0.000 | 0.000 | 0.000 | 0.034 | 0.000 | 0.869 | 0.096 | ||
| 2 spectra, ILHDFYVER | 0.037 | 0.000 | 0.000 | 0.000 | 0.210 | 0.000 | 0.754 | 0.000 | ||
| 2 spectra, TSTSK | 0.000 | 0.000 | 0.000 | 0.000 | 0.415 | 0.000 | 0.549 | 0.036 |
| Plot | Lyso | Other | |||||||||||
| Expt C |
3 peptides |
4 spectra |
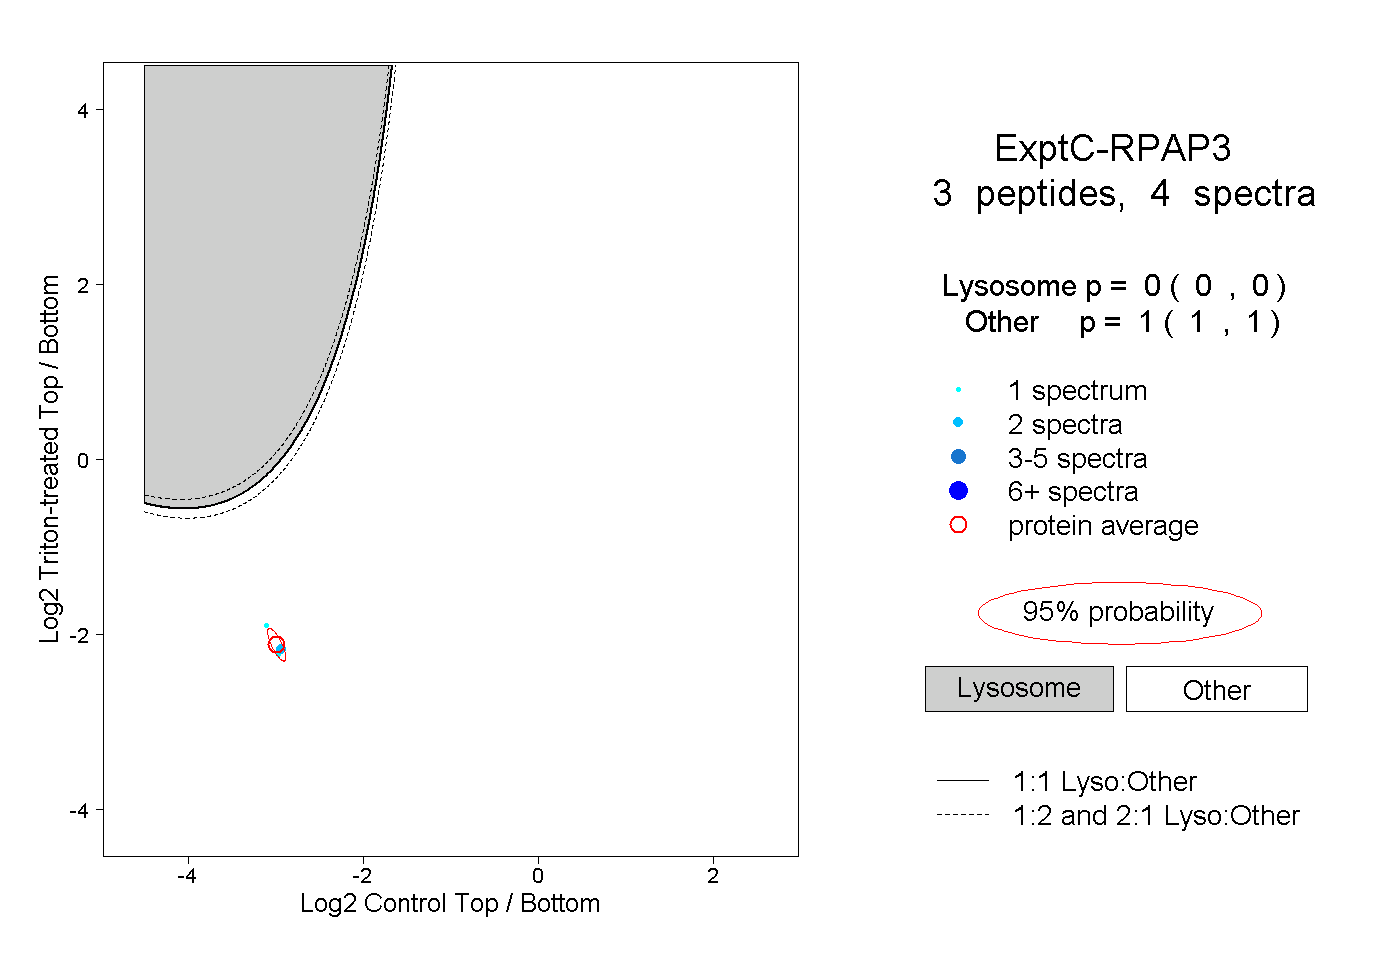 |
0.000 0.000 | 0.000 |
1.000 1.000 | 1.000 |