 1
1peptide
spectra
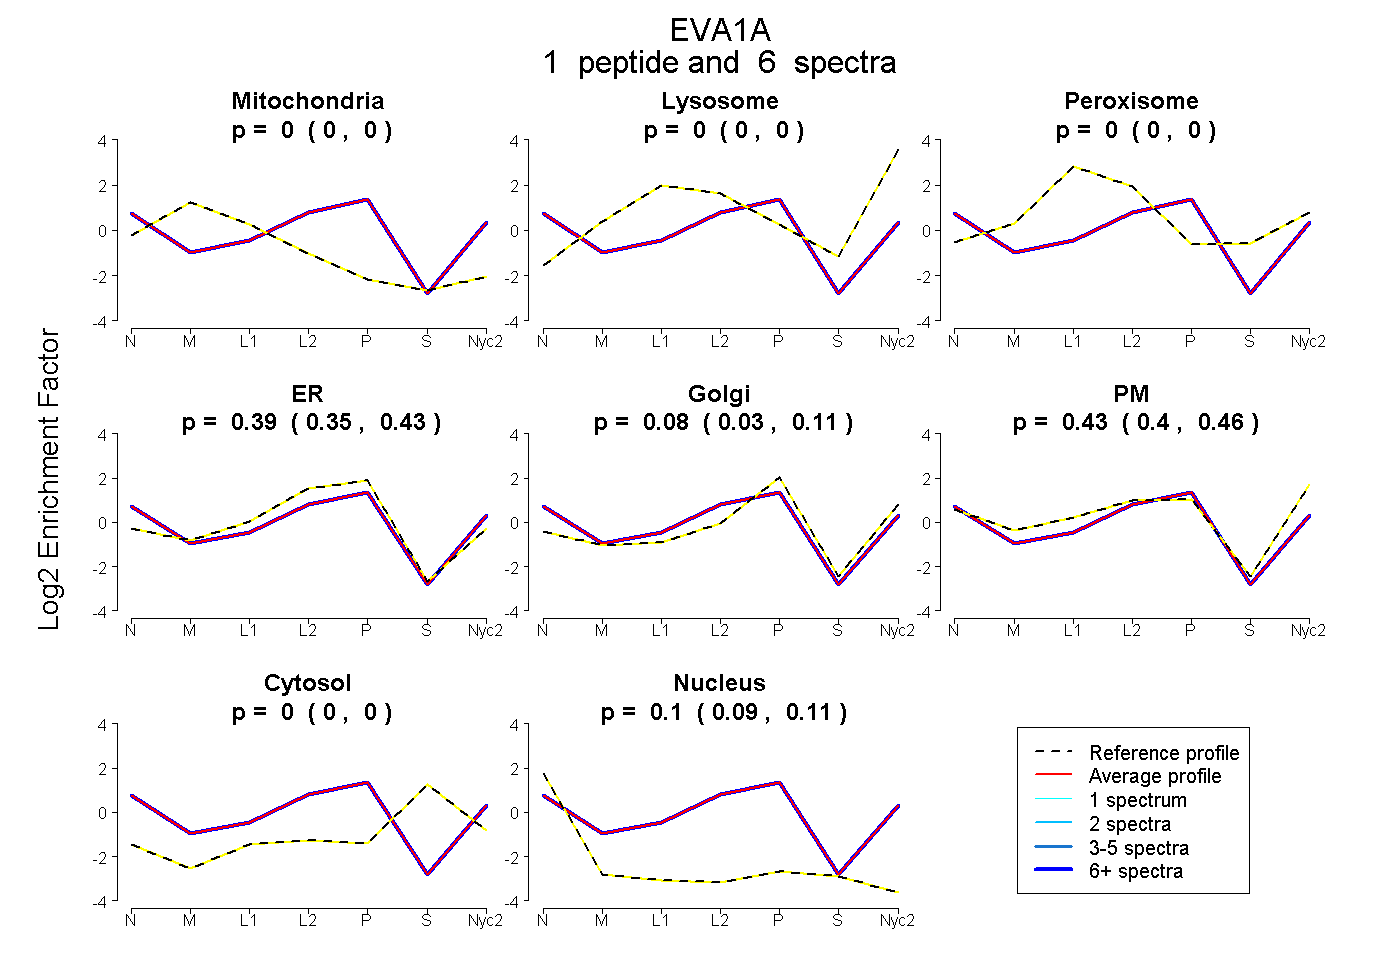
0.000 | 0.000
0.000 | 0.000
0.000 | 0.000
0.348 | 0.425
0.033 | 0.108
0.395 | 0.462
0.000 | 0.000
0.095 | 0.111
1peptide
spectra
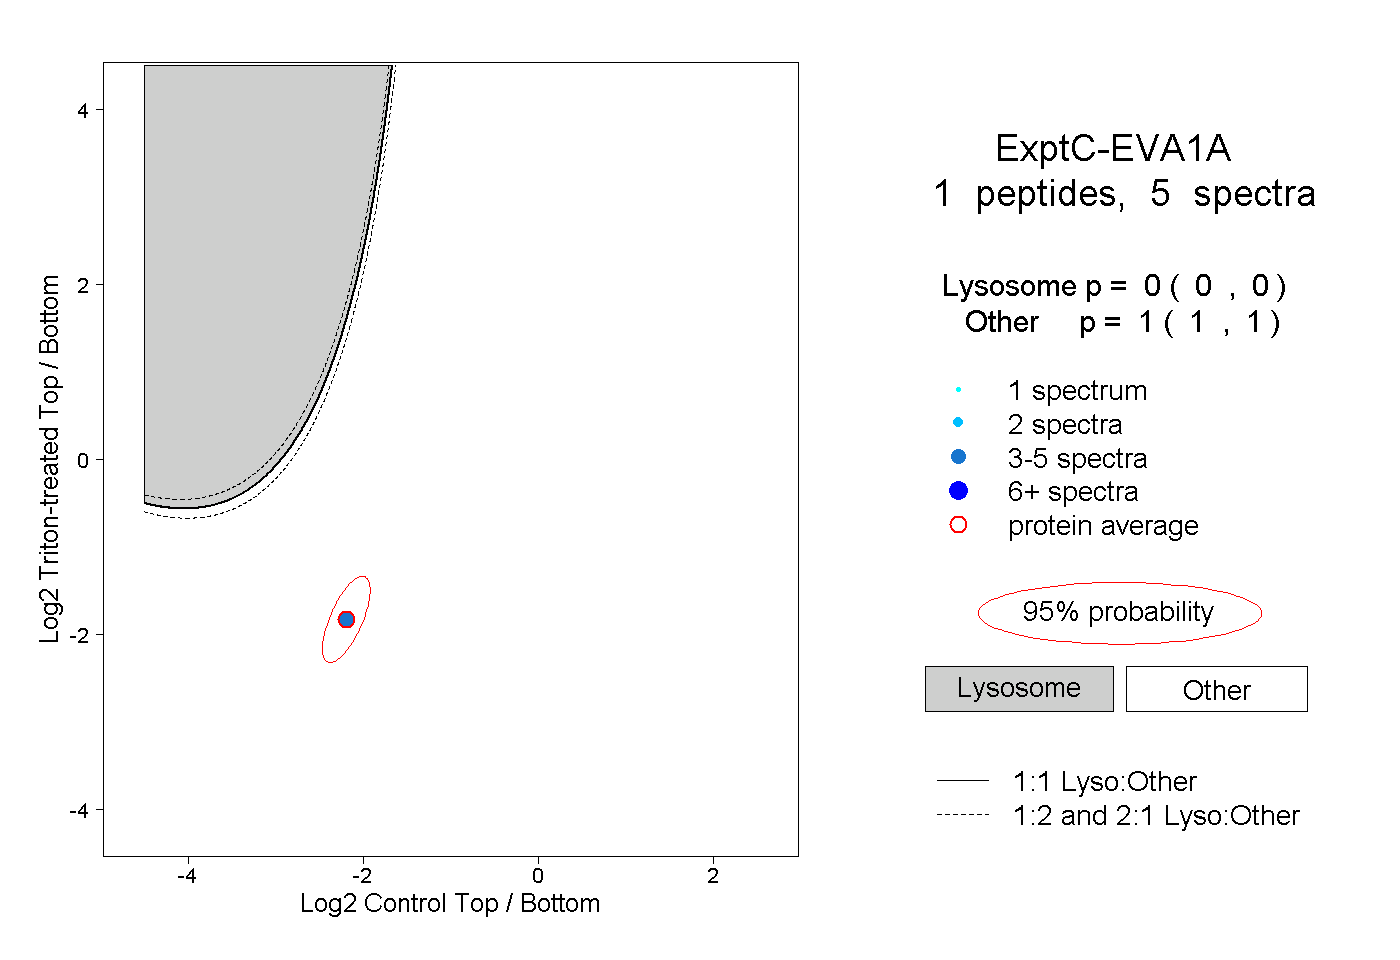
0.000 | 0.000
1.000 | 1.000
1peptide
spectrum
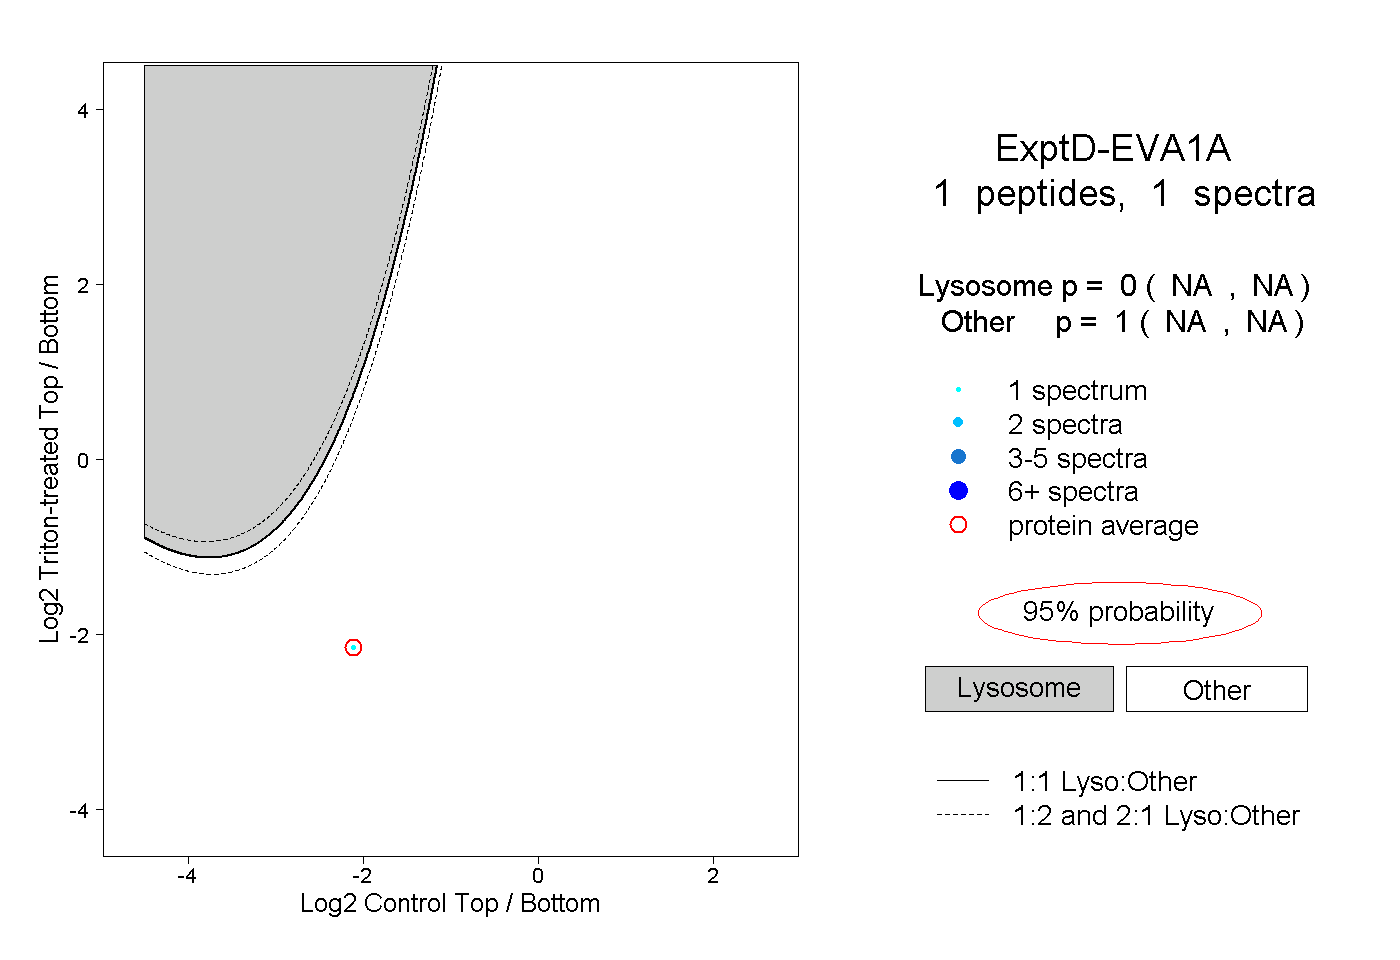
NA | NA
NA | NA