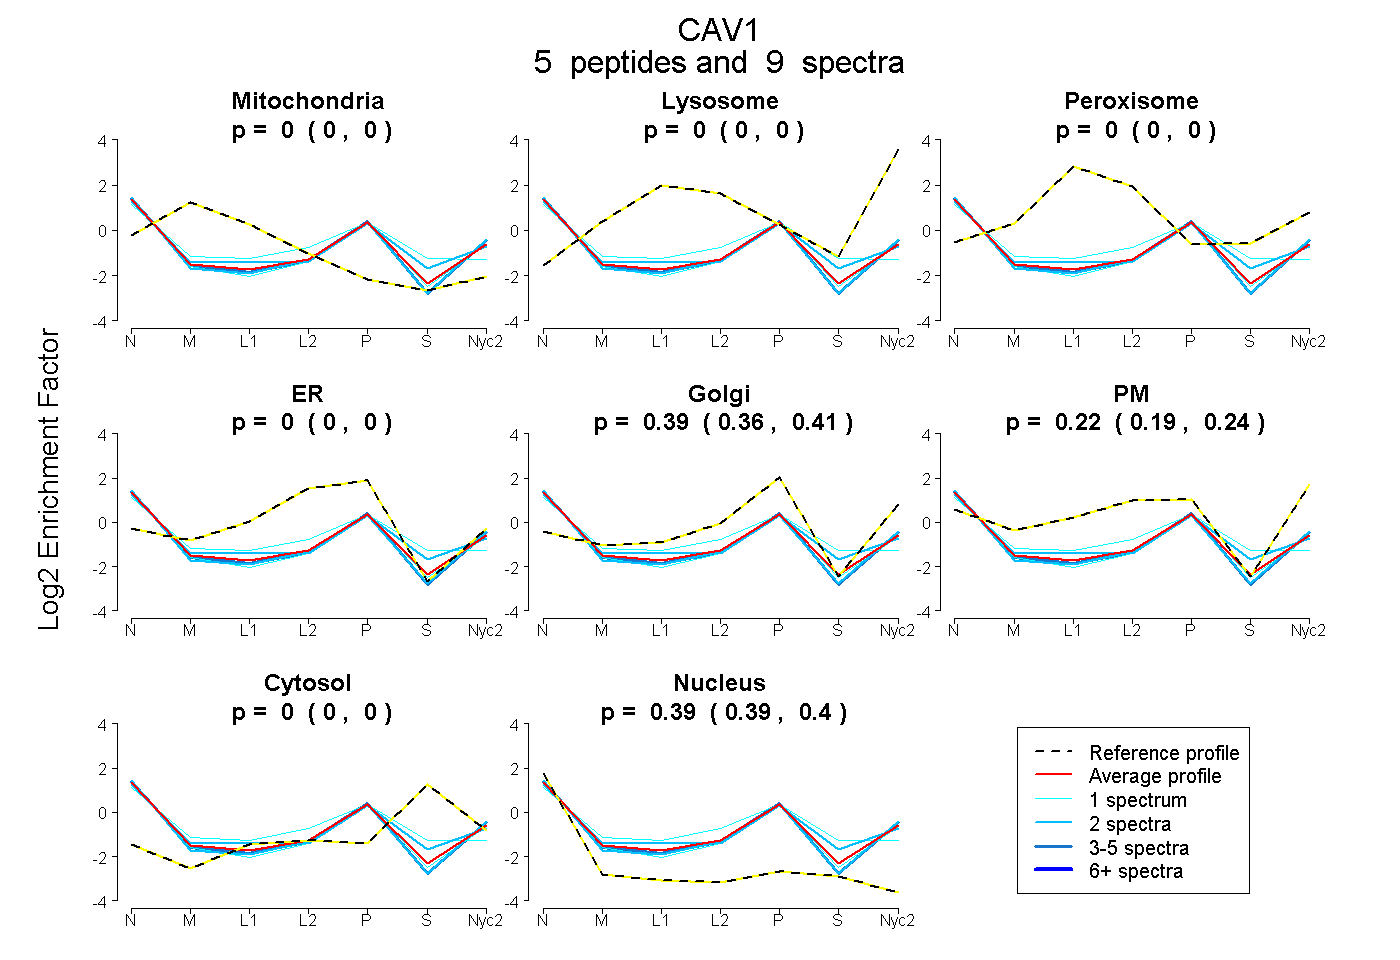
 5
5peptides
spectra
0.000 | 0.000
0.000 | 0.000
0.000 | 0.000
0.000 | 0.000
0.362 | 0.407
0.193 | 0.241
0.000 | 0.000
0.386 | 0.400
| Plot | Mito | Lyso | Perox | ER | Golgi | PM | Cytosol | Nucleus | |||||
| Expt A |
5 peptides |
9 spectra |
|
0.000 0.000 | 0.000 |
0.000 0.000 | 0.000 |
0.000 0.000 | 0.000 |
0.000 0.000 | 0.000 |
0.387 0.362 | 0.407 |
0.219 0.193 | 0.241 |
0.000 0.000 | 0.000 |
0.394 0.386 | 0.400 |
| 1 spectrum, EIDLVNR | 0.000 | 0.000 | 0.000 | 0.000 | 0.456 | 0.133 | 0.000 | 0.410 | ||
| 1 spectrum, QVYDAHTK | 0.000 | 0.000 | 0.000 | 0.260 | 0.055 | 0.206 | 0.168 | 0.310 | ||
| 2 spectra, YVDSEGHLYTVPIR | 0.000 | 0.000 | 0.000 | 0.000 | 0.315 | 0.247 | 0.082 | 0.356 | ||
| 2 spectra, HLNDDVVK | 0.000 | 0.000 | 0.000 | 0.000 | 0.388 | 0.212 | 0.000 | 0.401 | ||
| 3 spectra, AMADEVNEK | 0.000 | 0.000 | 0.000 | 0.000 | 0.406 | 0.201 | 0.000 | 0.393 |
| Plot | Mito | Lyso or Perox | ER | Golgi | PM | Cytosol | Nucleus | ||||||
| Expt B |
2 peptides |
2 spectra |
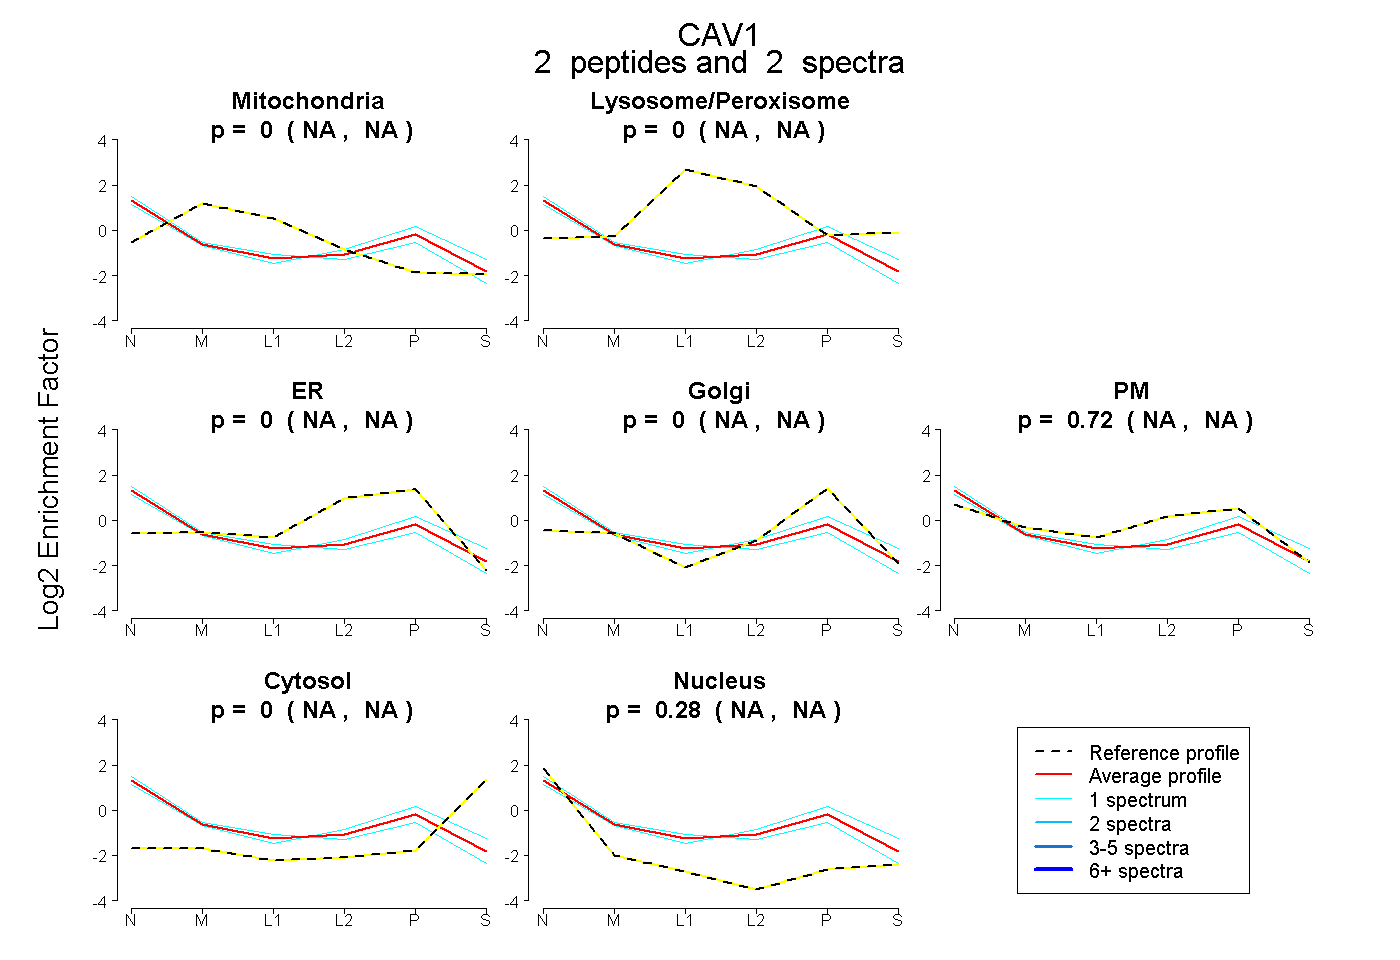 |
0.000 NA | NA |
0.000 NA | NA |
0.000 NA | NA |
0.000 NA | NA |
0.717 NA | NA |
0.000 NA | NA |
0.283 NA | NA |
|||
| Plot | Lyso | Other | |||||||||||
| Expt C |
3 peptides |
9 spectra |
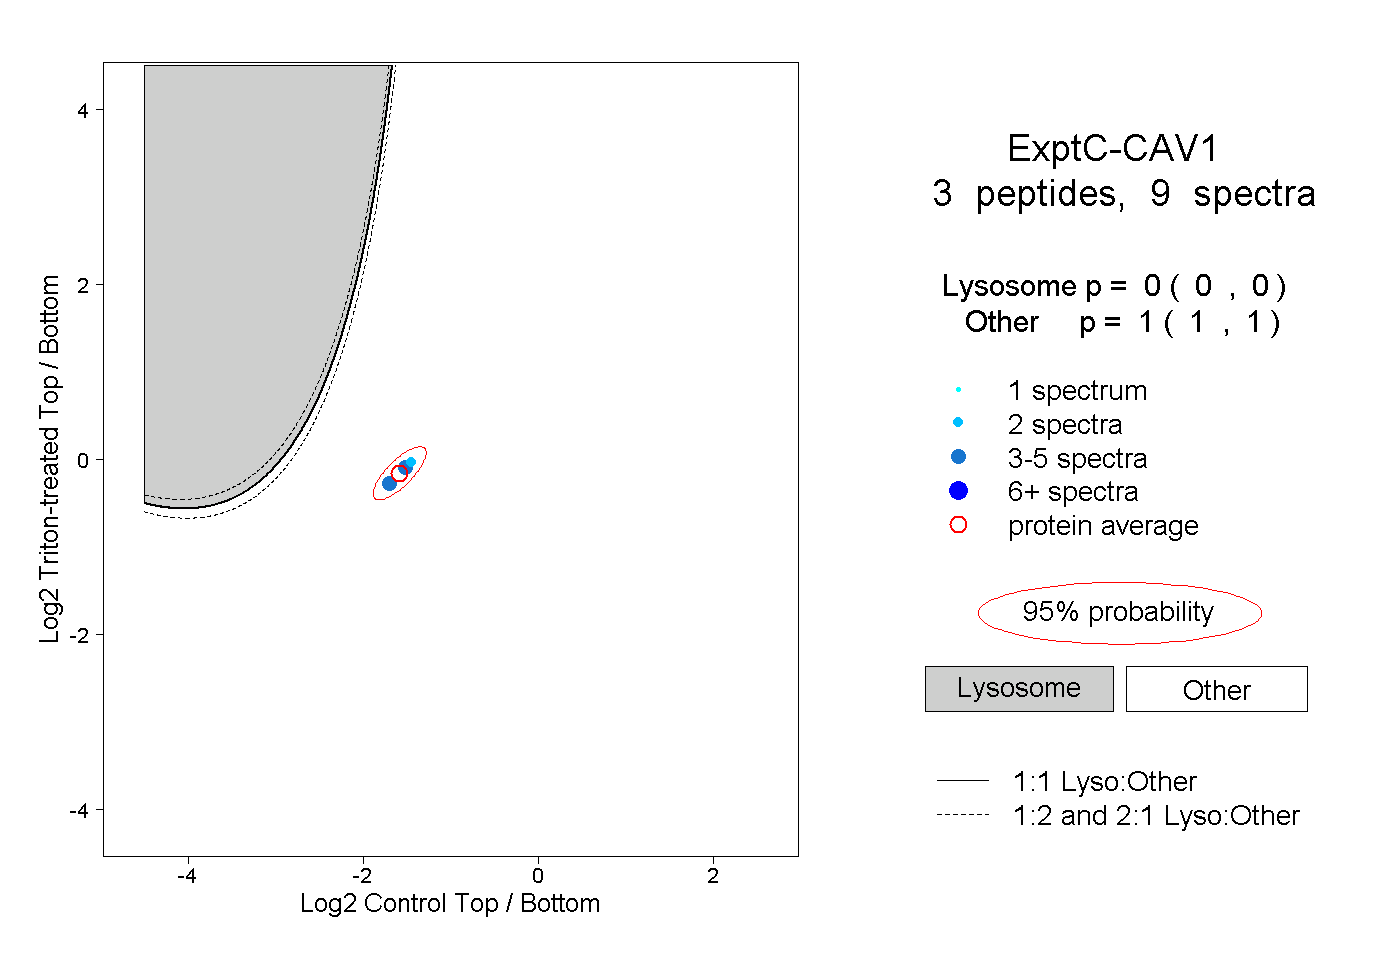 |
0.000 0.000 | 0.000 |
1.000 1.000 | 1.000 |