 13
13peptides
spectra
0.000 | 0.000
0.302 | 0.319
0.000 | 0.000
0.188 | 0.225
0.164 | 0.203
0.000 | 0.000
0.288 | 0.304
0.000 | 0.000
| Plot | Mito | Lyso | Perox | ER | Golgi | PM | Cytosol | Nucleus | |||||
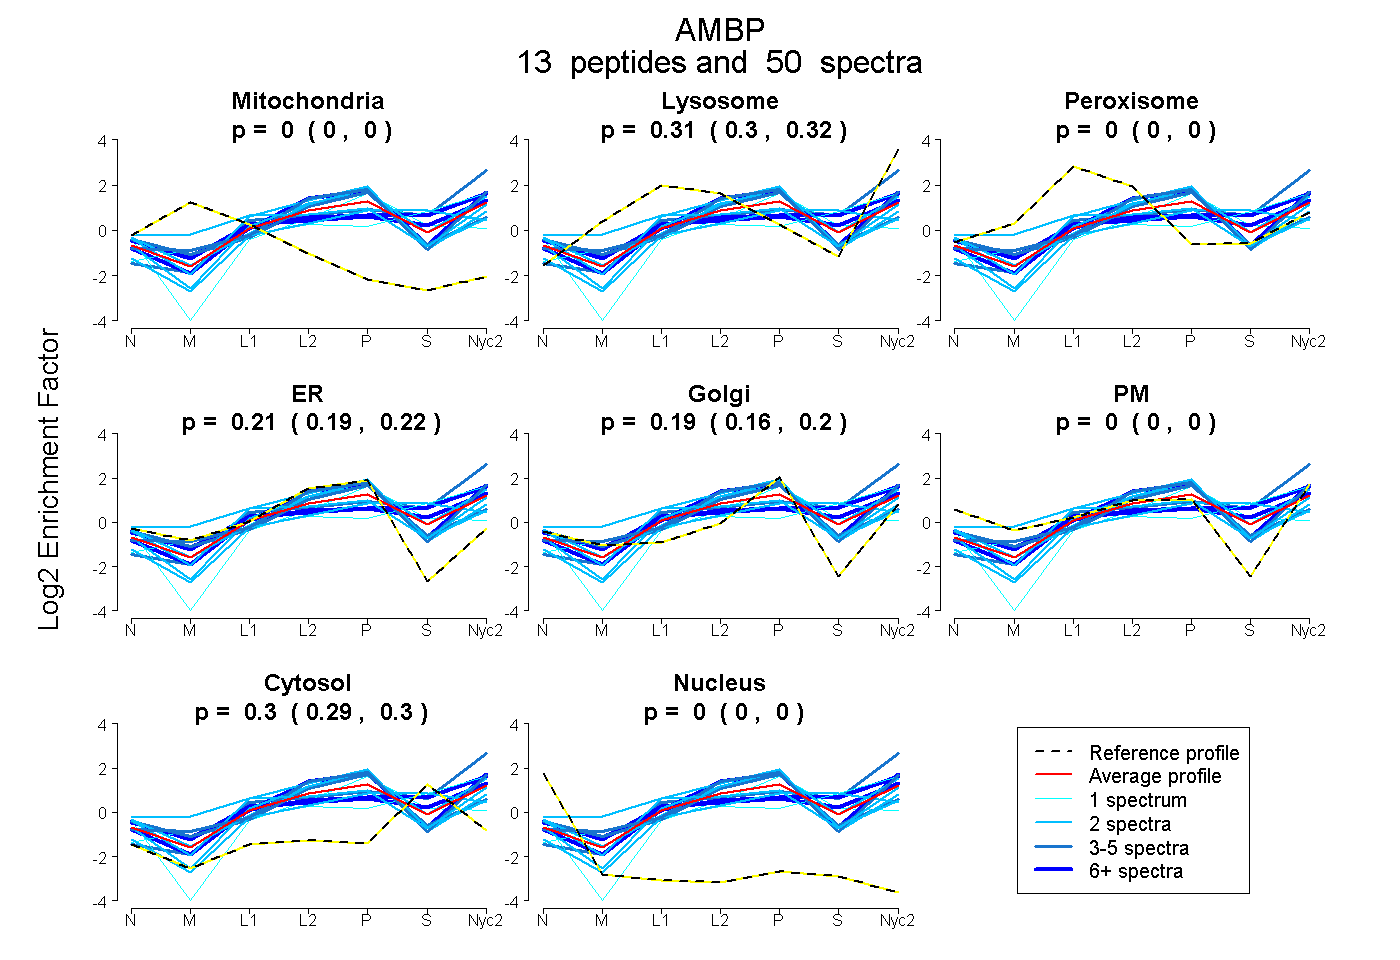
| Expt A |
13 peptides |
50 spectra |
|
0.000 0.000 | 0.000 |
0.311 0.302 | 0.319 |
0.000 0.000 | 0.000 |
0.207 0.188 | 0.225 |
0.186 0.164 | 0.203 |
0.000 0.000 | 0.000 |
0.296 0.288 | 0.304 |
0.000 0.000 | 0.000 |
| 4 spectra, EVESTSFAR | 0.000 | 0.161 | 0.000 | 0.441 | 0.184 | 0.000 | 0.214 | 0.000 | ||
| 1 spectrum, EDSCQLNYSEGPCLGMQQK | 0.000 | 0.475 | 0.000 | 0.000 | 0.036 | 0.000 | 0.489 | 0.000 | ||
| 14 spectra, ECLQTCR | 0.000 | 0.413 | 0.000 | 0.000 | 0.139 | 0.008 | 0.440 | 0.000 | ||
| 2 spectra, EYCGVPGDGYEELTR | 0.000 | 0.183 | 0.000 | 0.203 | 0.034 | 0.000 | 0.581 | 0.000 | ||
| 1 spectrum, AVLPQENEGSGSEPLITGTLK | 0.000 | 0.000 | 0.000 | 0.374 | 0.135 | 0.000 | 0.491 | 0.000 | ||
| 2 spectra, GECVPGDR | 0.000 | 0.129 | 0.000 | 0.511 | 0.151 | 0.000 | 0.209 | 0.000 | ||
| 4 spectra, AFAELWAFDAAQGK | 0.000 | 0.573 | 0.000 | 0.000 | 0.067 | 0.000 | 0.360 | 0.000 | ||
| 2 spectra, TIAACNLPIVQGPCR | 0.000 | 0.116 | 0.322 | 0.000 | 0.354 | 0.113 | 0.096 | 0.000 | ||
| 2 spectra, GVCEEISGVYQK | 0.000 | 0.216 | 0.000 | 0.576 | 0.043 | 0.000 | 0.165 | 0.000 | ||
| 6 spectra, CIQFIYGGCK | 0.000 | 0.270 | 0.059 | 0.000 | 0.080 | 0.220 | 0.371 | 0.000 | ||
| 6 spectra, DSLLQEFR | 0.000 | 0.347 | 0.000 | 0.234 | 0.288 | 0.019 | 0.111 | 0.000 | ||
| 4 spectra, HGPTITAK | 0.000 | 0.344 | 0.000 | 0.204 | 0.363 | 0.000 | 0.089 | 0.000 | ||
| 2 spectra, EVALSVGIPENSIVFMADR | 0.000 | 0.293 | 0.000 | 0.217 | 0.216 | 0.000 | 0.274 | 0.000 |
| Plot | Mito | Lyso or Perox | ER | Golgi | PM | Cytosol | Nucleus | ||||||
| Expt B |
8 peptides |
21 spectra |
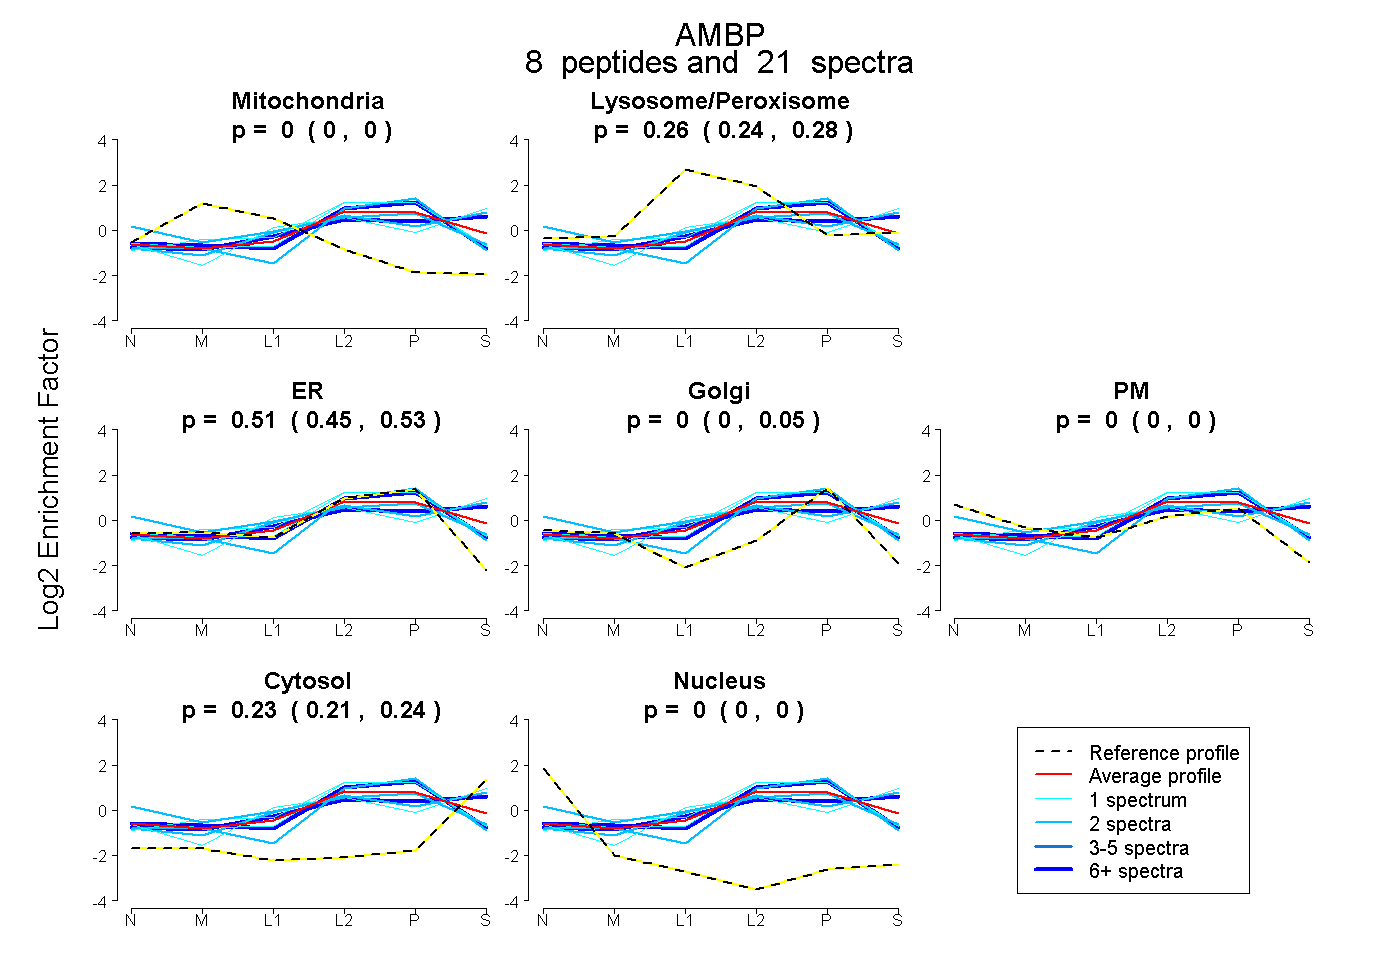 |
0.000 0.000 | 0.000 |
0.256 0.237 | 0.279 |
0.509 0.445 | 0.531 |
0.003 0.000 | 0.046 |
0.000 0.000 | 0.000 |
0.232 0.210 | 0.244 |
0.000 0.000 | 0.000 |
|||
| Plot | Lyso | Other | |||||||||||
| Expt C |
10 peptides |
88 spectra |
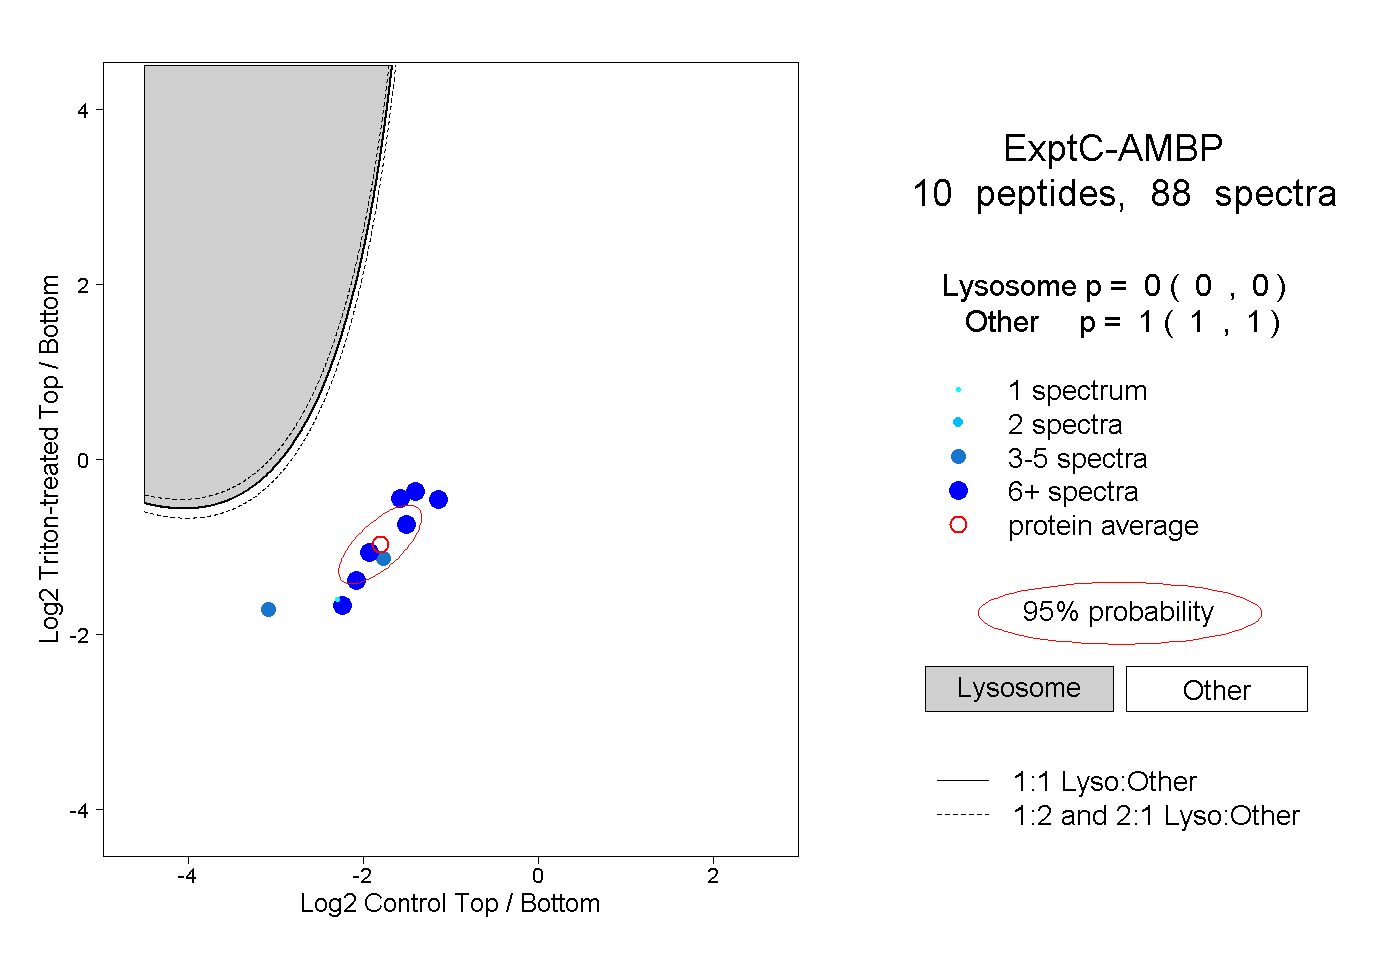 |
0.000 0.000 | 0.000 |
1.000 1.000 | 1.000 |
||||||||
| Plot | Lyso | Other | |||||||||||
| Expt D |
6 peptides |
15 spectra |
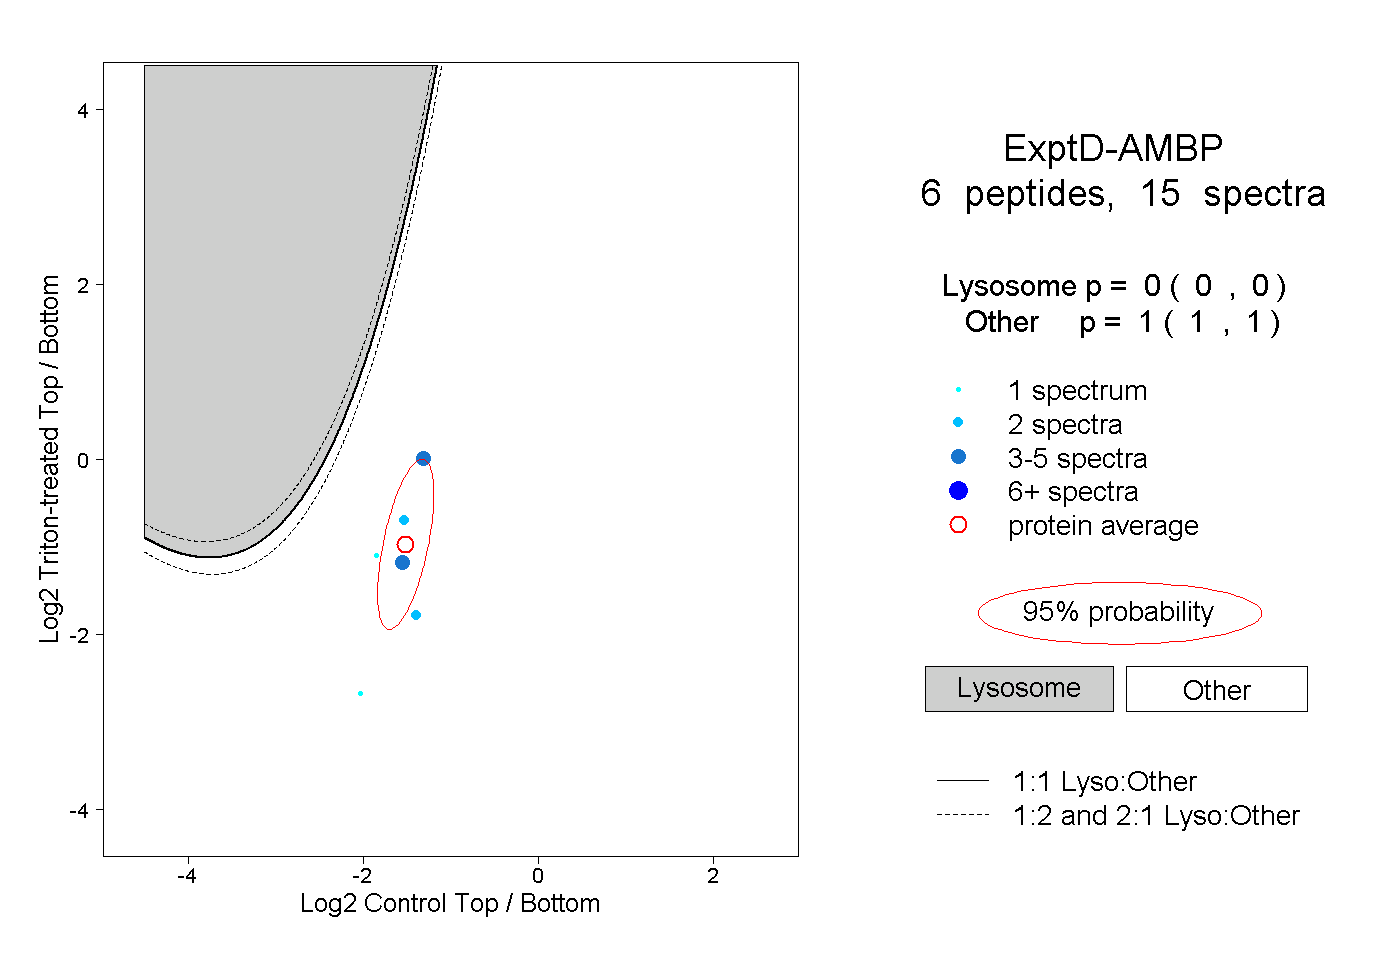 |
0.000 0.000 | 0.000 |
1.000 1.000 | 1.000 |