12
12peptides
spectra
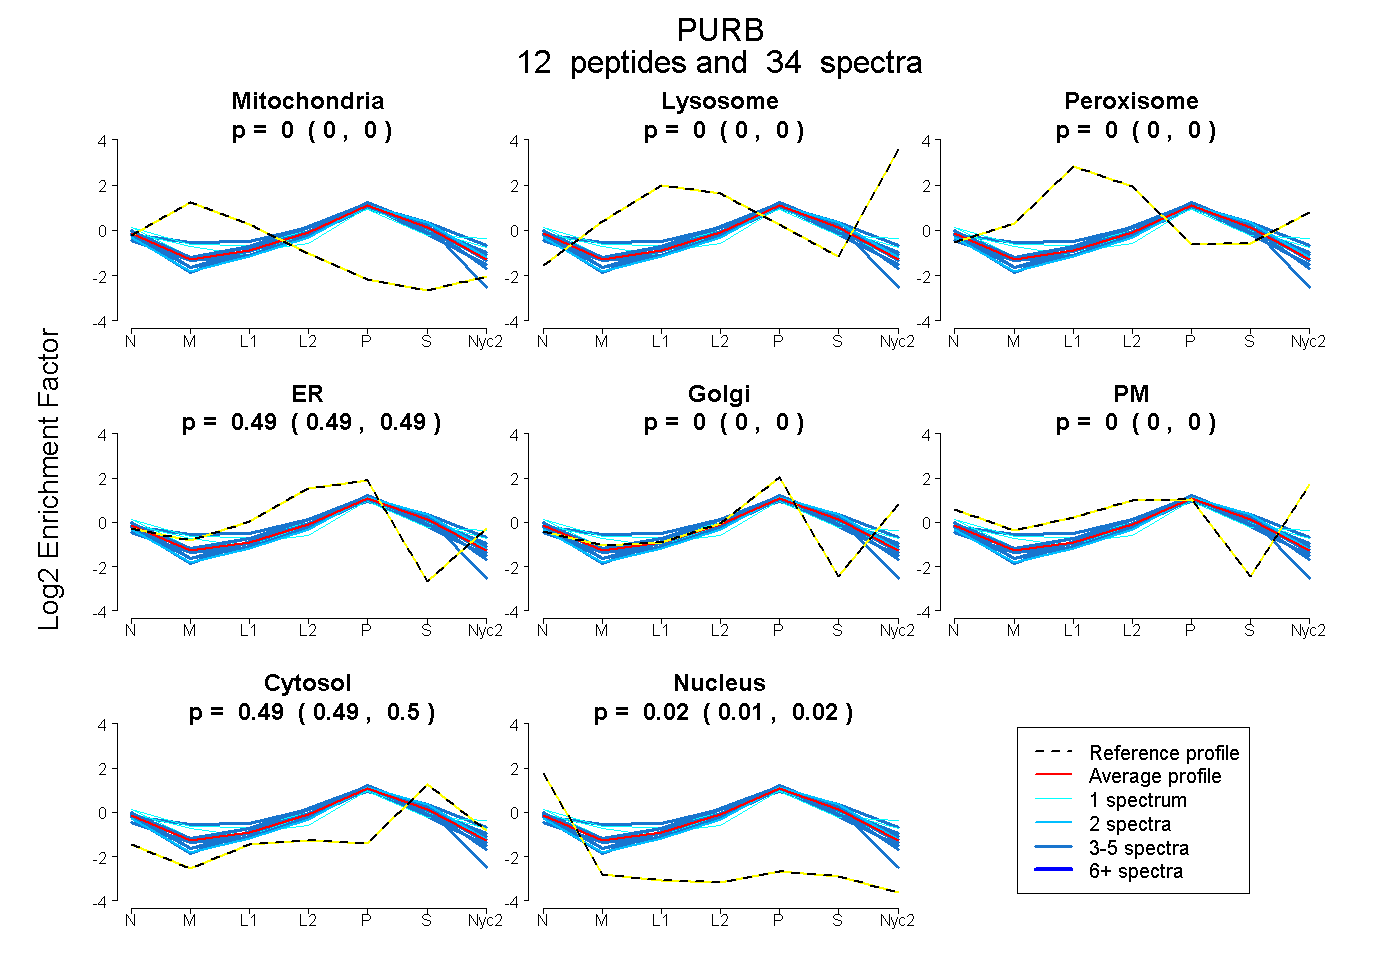
0.000 | 0.000
0.000 | 0.000
0.000 | 0.000
0.486 | 0.493
0.000 | 0.000
0.000 | 0.000
0.490 | 0.498
0.011 | 0.019
6peptides
spectra
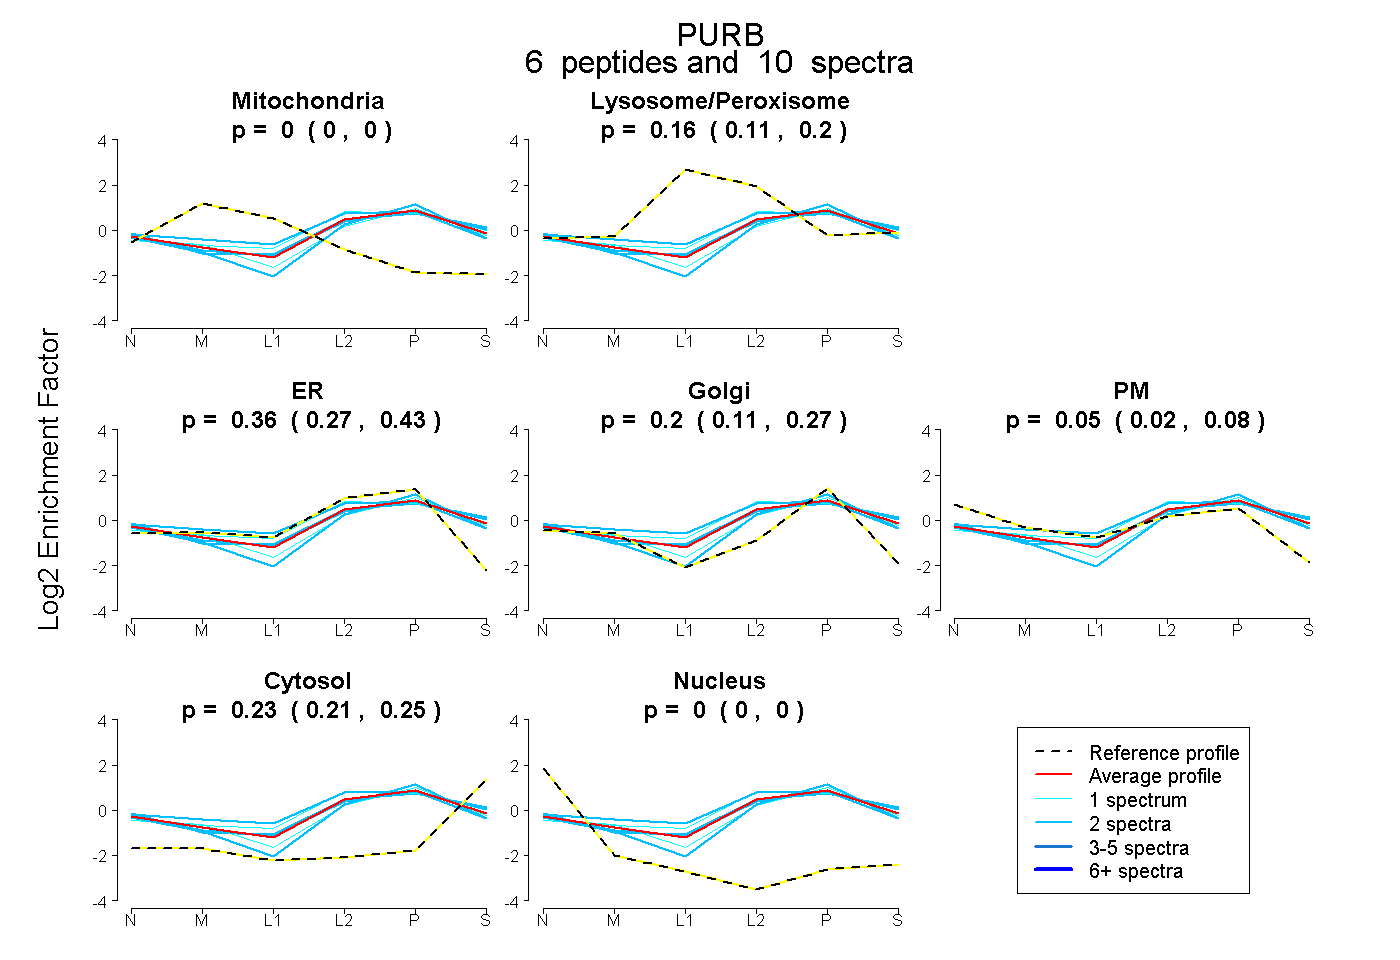
0.000 | 0.000
0.111 | 0.204
0.274 | 0.427
0.110 | 0.268
0.016 | 0.084
0.208 | 0.254
0.000 | 0.000