 12
12peptides
spectra
0.000 | 0.000
0.000 | 0.000
0.000 | 0.000
0.486 | 0.493
0.000 | 0.000
0.000 | 0.000
0.490 | 0.498
0.011 | 0.019
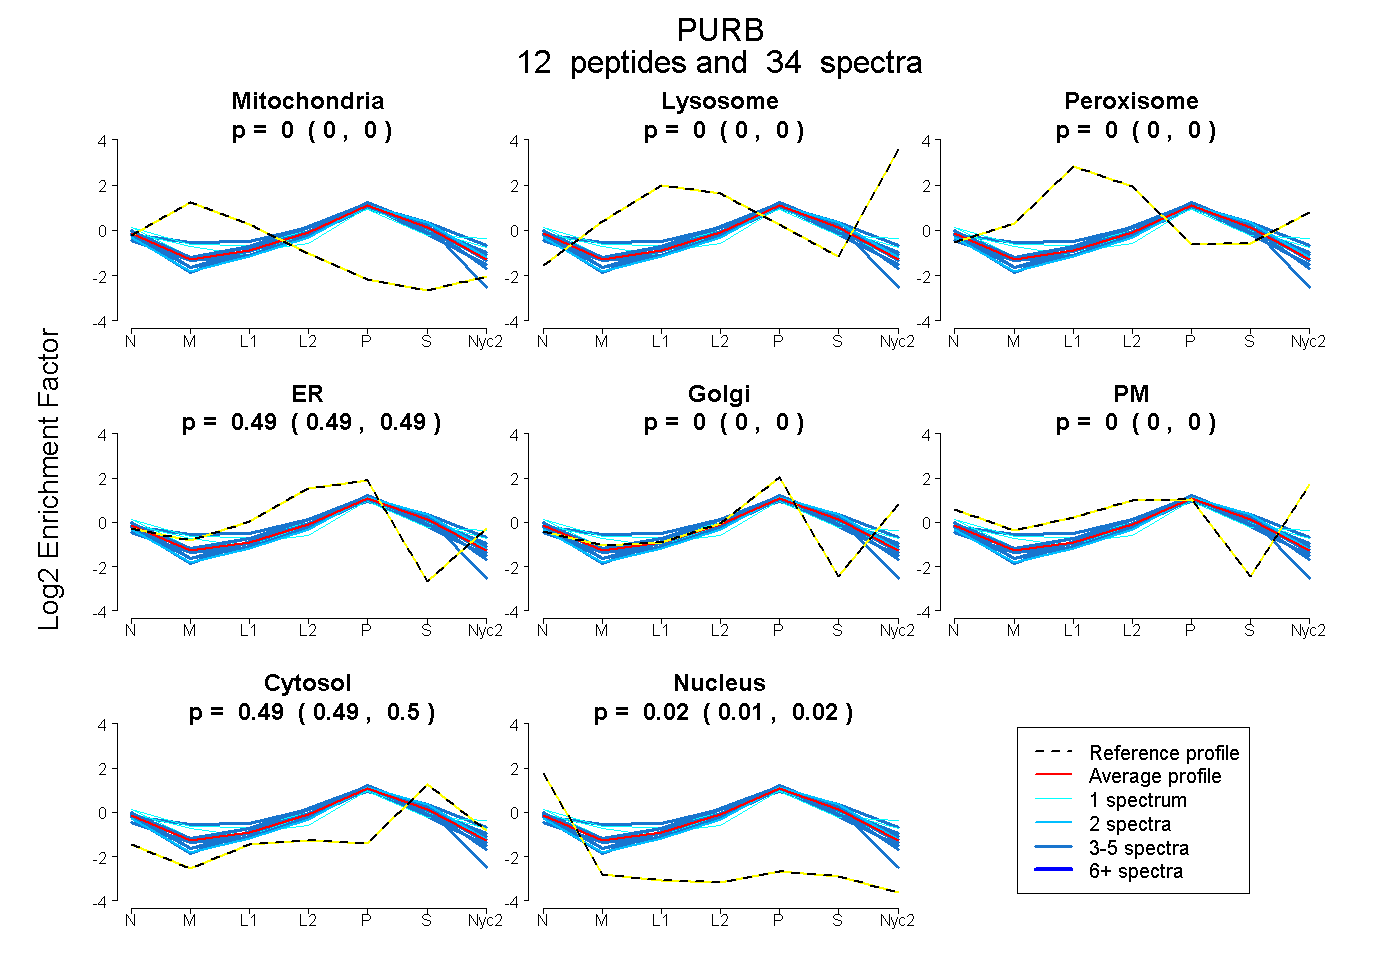
| Plot | Mito | Lyso | Perox | ER | Golgi | PM | Cytosol | Nucleus | |||||
| Expt A |
12 peptides |
34 spectra |
|
0.000 0.000 | 0.000 |
0.000 0.000 | 0.000 |
0.000 0.000 | 0.000 |
0.490 0.486 | 0.493 |
0.000 0.000 | 0.000 |
0.000 0.000 | 0.000 |
0.494 0.490 | 0.498 |
0.016 0.011 | 0.019 |
| 1 spectrum, NAITVPFK | 0.026 | 0.000 | 0.000 | 0.355 | 0.176 | 0.000 | 0.443 | 0.000 | ||
| 4 spectra, FGGAFCR | 0.093 | 0.000 | 0.000 | 0.523 | 0.000 | 0.000 | 0.384 | 0.000 | ||
| 4 spectra, YGVFLR | 0.000 | 0.000 | 0.000 | 0.484 | 0.000 | 0.000 | 0.499 | 0.017 | ||
| 5 spectra, FYIDVK | 0.000 | 0.000 | 0.000 | 0.461 | 0.000 | 0.000 | 0.491 | 0.049 | ||
| 3 spectra, YADEMK | 0.000 | 0.000 | 0.000 | 0.420 | 0.030 | 0.000 | 0.550 | 0.000 | ||
| 1 spectrum, IAEVGAGGSK | 0.000 | 0.000 | 0.000 | 0.388 | 0.085 | 0.000 | 0.454 | 0.073 | ||
| 3 spectra, FFFDVGCNK | 0.000 | 0.000 | 0.000 | 0.445 | 0.000 | 0.000 | 0.460 | 0.095 | ||
| 2 spectra, YYLDLK | 0.000 | 0.000 | 0.000 | 0.359 | 0.072 | 0.000 | 0.565 | 0.005 | ||
| 3 spectra, VSEVKPSYR | 0.000 | 0.000 | 0.000 | 0.472 | 0.034 | 0.000 | 0.493 | 0.000 | ||
| 1 spectrum, LTLSMAVAAEFR | 0.024 | 0.000 | 0.035 | 0.261 | 0.140 | 0.159 | 0.380 | 0.000 | ||
| 4 spectra, SEFLVR | 0.000 | 0.000 | 0.000 | 0.550 | 0.000 | 0.000 | 0.450 | 0.000 | ||
| 3 spectra, GGGGGGPGSFQPAPR | 0.000 | 0.000 | 0.000 | 0.316 | 0.142 | 0.000 | 0.542 | 0.000 |
| Plot | Mito | Lyso or Perox | ER | Golgi | PM | Cytosol | Nucleus | ||||||
| Expt B |
6 peptides |
10 spectra |
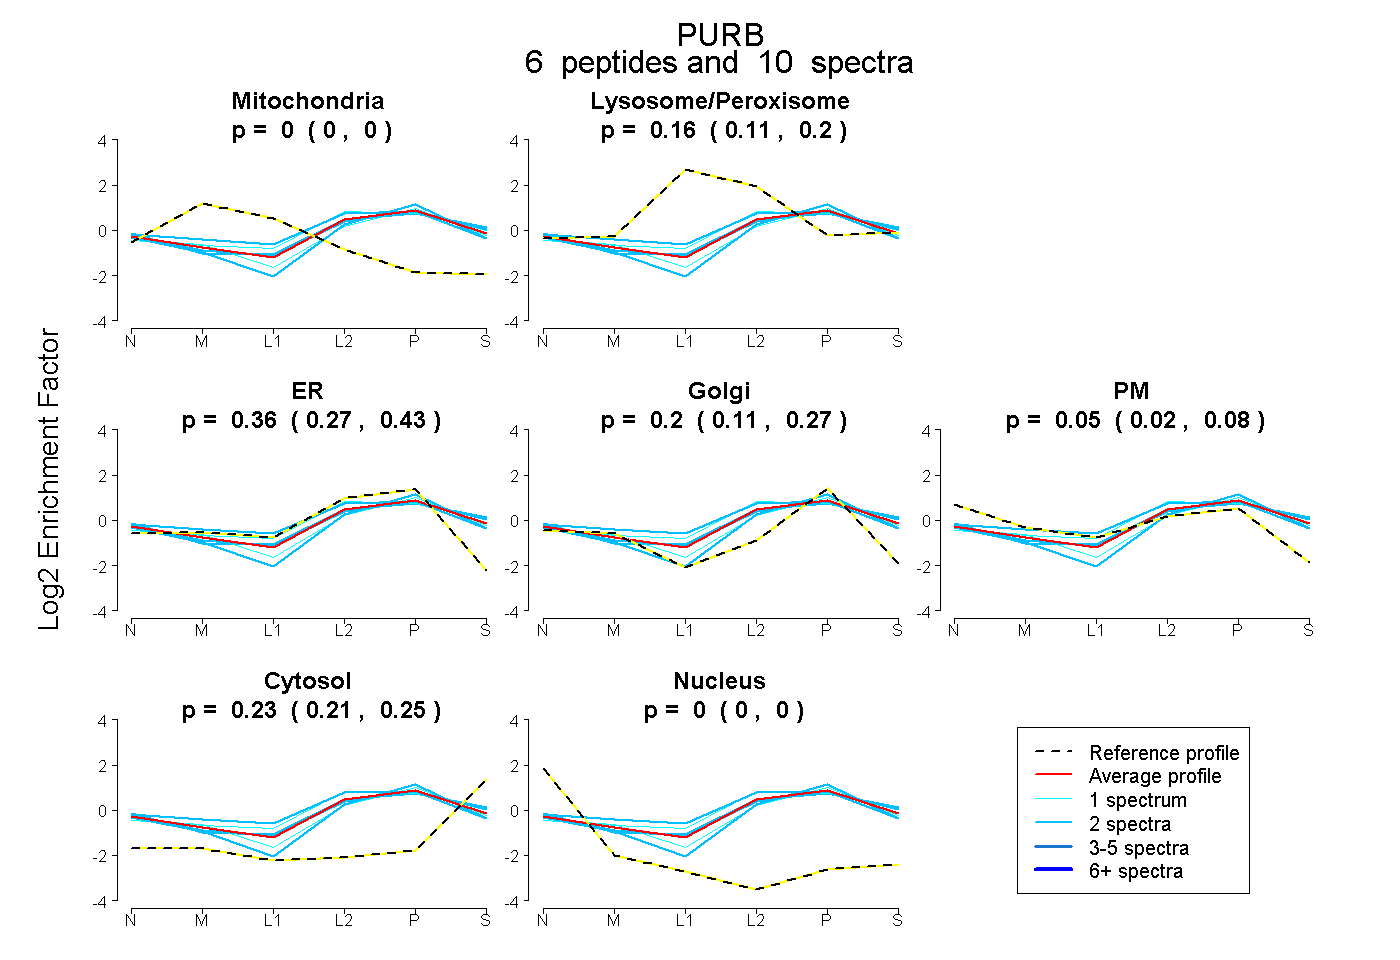 |
0.000 0.000 | 0.000 |
0.164 0.111 | 0.204 |
0.356 0.274 | 0.427 |
0.197 0.110 | 0.268 |
0.052 0.016 | 0.084 |
0.232 0.208 | 0.254 |
0.000 0.000 | 0.000 |
|||
| Plot | Lyso | Other | |||||||||||
| Expt C |
11 peptides |
42 spectra |
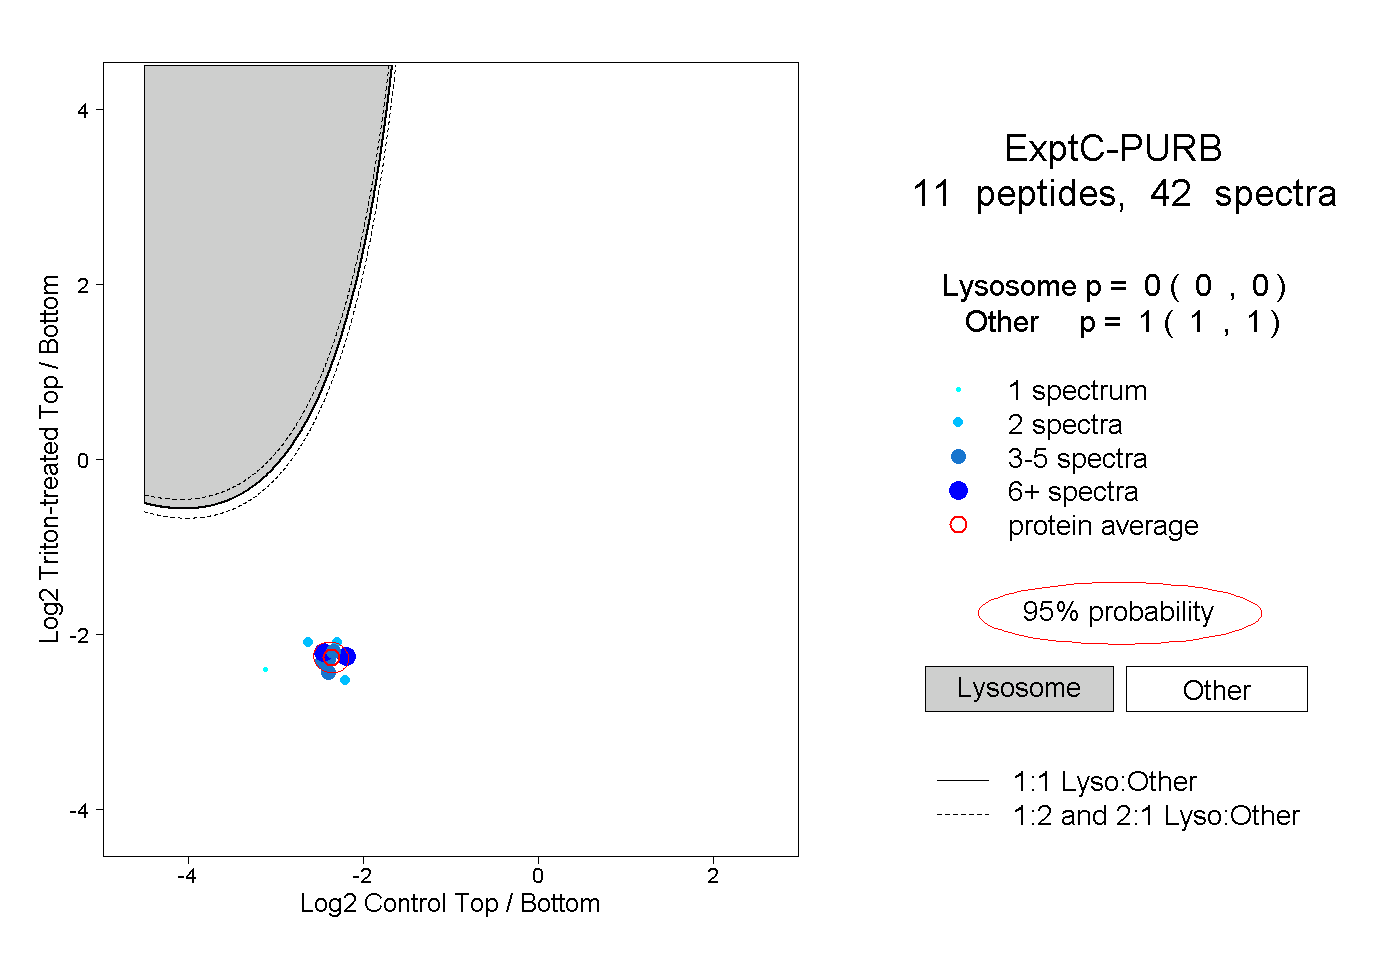 |
0.000 0.000 | 0.000 |
1.000 1.000 | 1.000 |
||||||||
| Plot | Lyso | Other | |||||||||||
| Expt D |
2 peptides |
3 spectra |
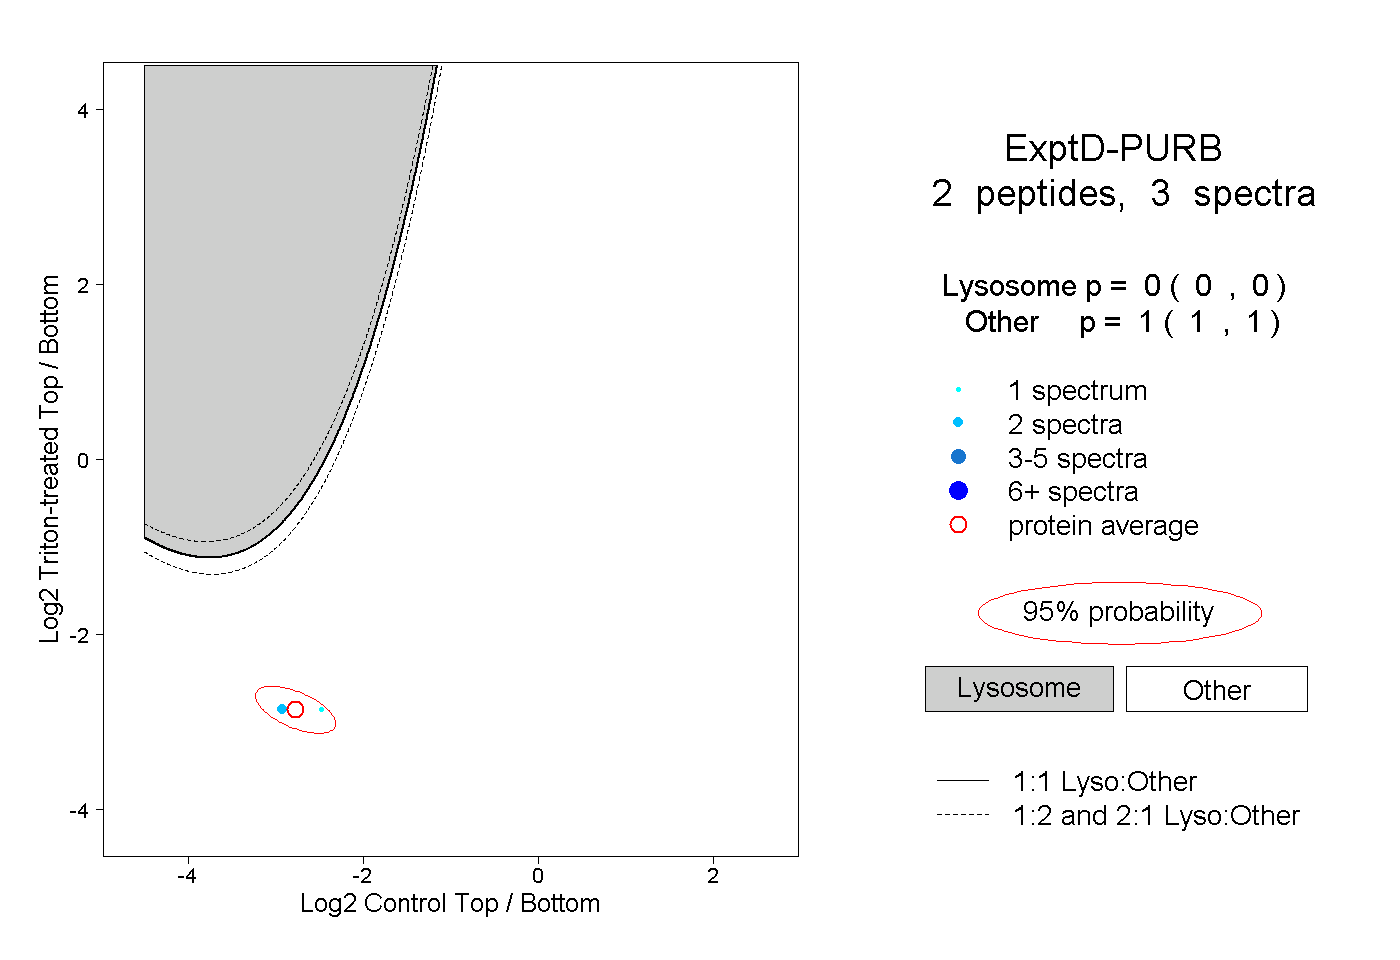 |
0.000 0.000 | 0.000 |
1.000 1.000 | 1.000 |