 9
9peptides
spectra
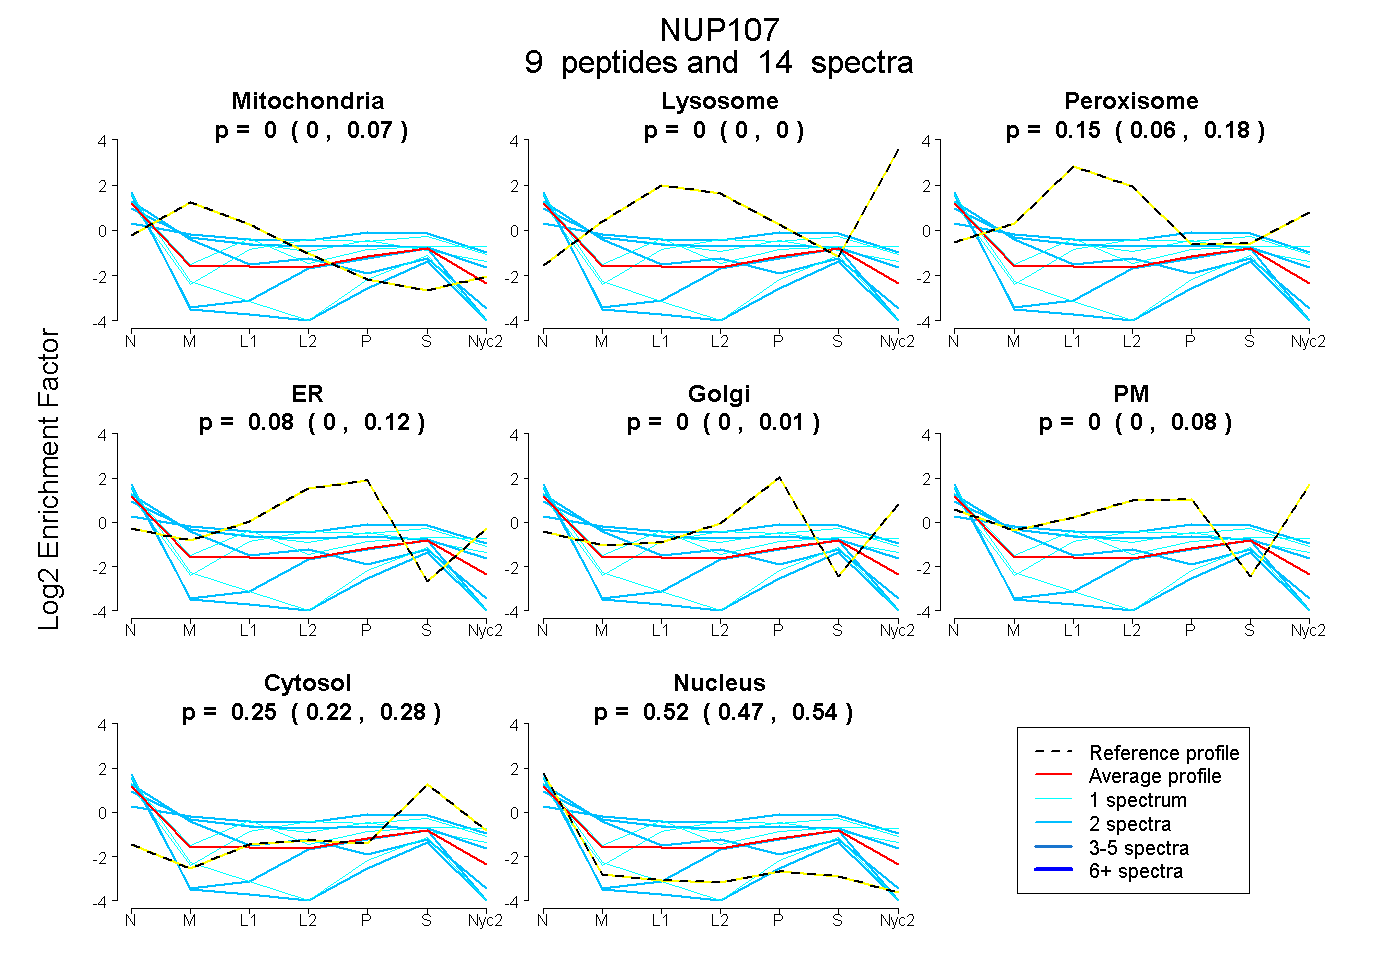
0.000 | 0.070
0.000 | 0.000
0.056 | 0.185
0.002 | 0.117
0.000 | 0.011
0.000 | 0.082
0.219 | 0.282
0.467 | 0.535
1peptide
spectrum
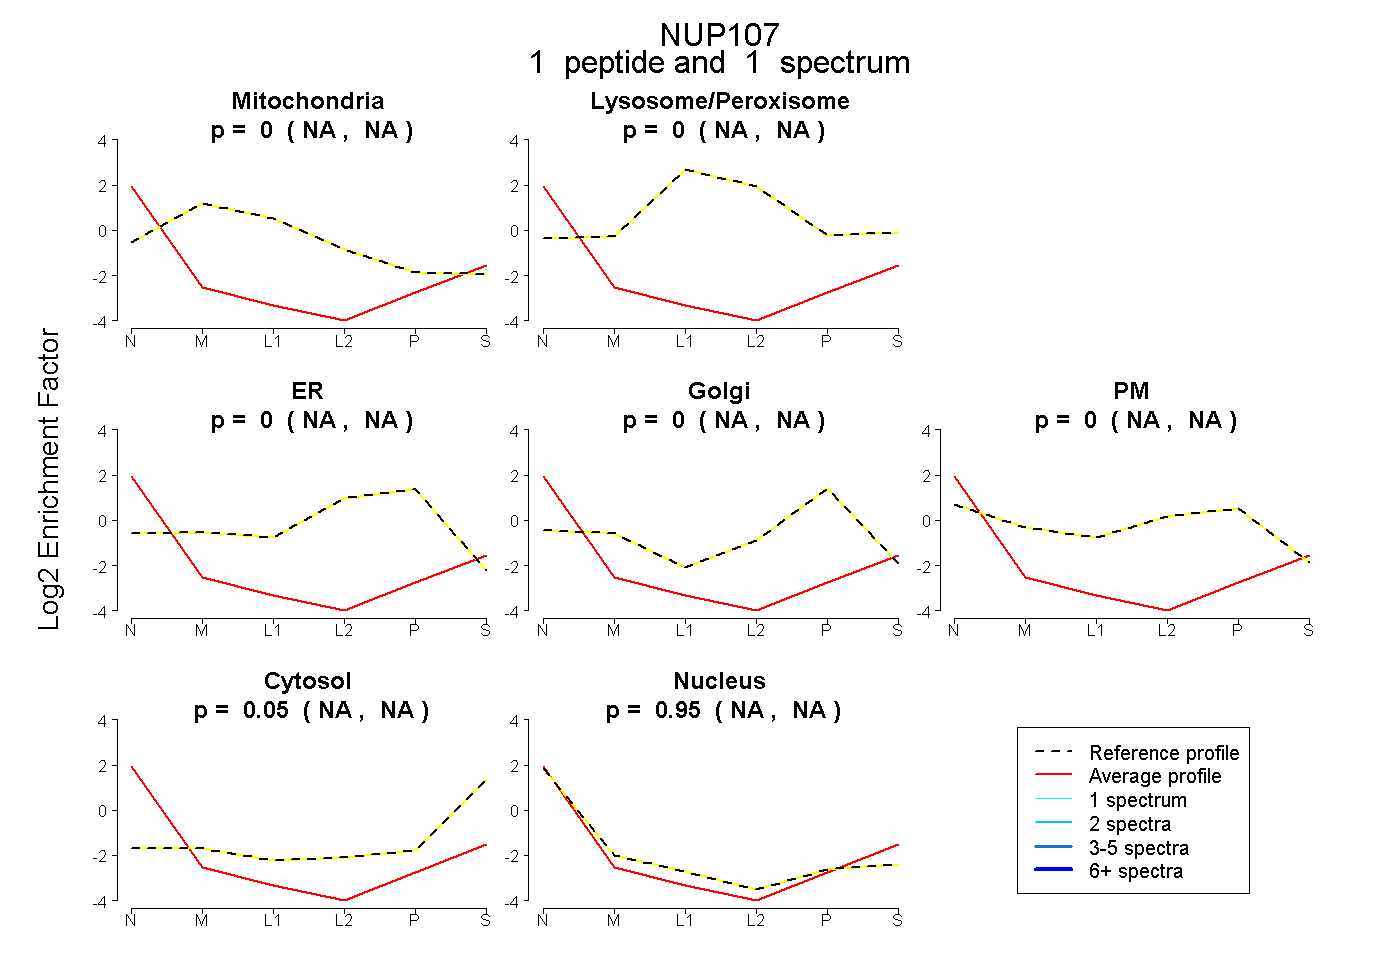
NA | NA
NA | NA
NA | NA
NA | NA
NA | NA
NA | NA
NA | NA
| Plot | Mito | Lyso | Perox | ER | Golgi | PM | Cytosol | Nucleus | |||||
| Expt A |
9 peptides |
14 spectra |
|
0.000 0.000 | 0.070 |
0.000 0.000 | 0.000 |
0.150 0.056 | 0.185 |
0.083 0.002 | 0.117 |
0.000 0.000 | 0.011 |
0.000 0.000 | 0.082 |
0.246 0.219 | 0.282 |
0.521 0.467 | 0.535 |
||
| Plot | Mito | Lyso or Perox | ER | Golgi | PM | Cytosol | Nucleus | ||||||
| Expt B |
1 peptide |
1 spectrum |
|
0.000 NA | NA |
0.000 NA | NA |
0.000 NA | NA |
0.000 NA | NA |
0.000 NA | NA |
0.052 NA | NA |
0.948 NA | NA |