 5
5peptides
spectra
0.820 | 0.932
0.000 | 0.000
0.000 | 0.000
0.000 | 0.000
0.000 | 0.000
0.000 | 0.000
0.000 | 0.000
0.057 | 0.172
2peptides
spectra
NA | NA
NA | NA
NA | NA
NA | NA
NA | NA
NA | NA
NA | NA
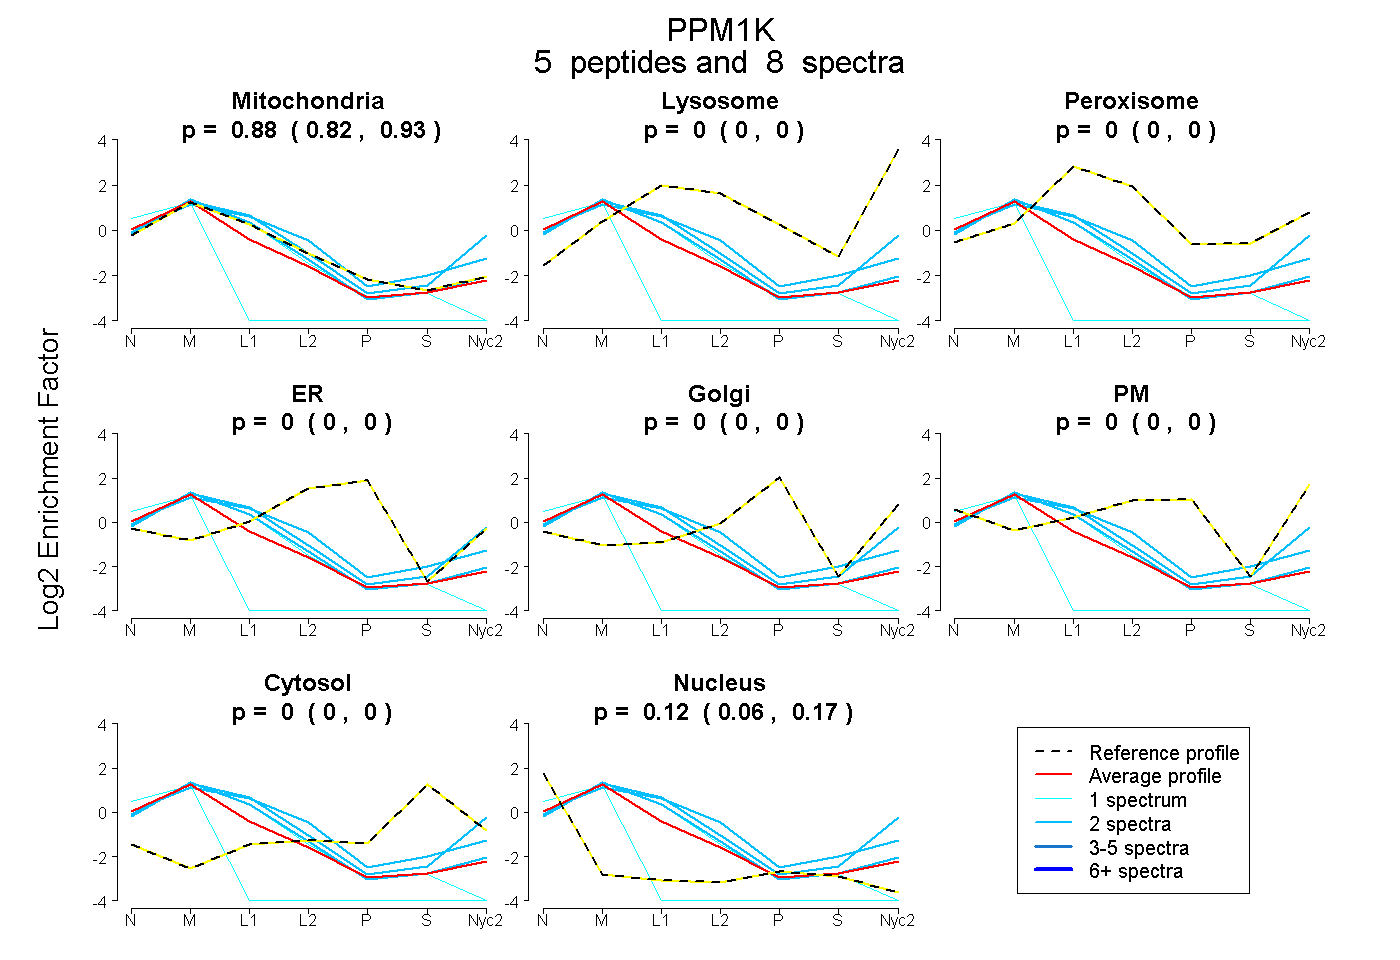
| Plot | Mito | Lyso | Perox | ER | Golgi | PM | Cytosol | Nucleus | |||||
| Expt A |
5 peptides |
8 spectra |
|
0.882 0.820 | 0.932 |
0.000 0.000 | 0.000 |
0.000 0.000 | 0.000 |
0.000 0.000 | 0.000 |
0.000 0.000 | 0.000 |
0.000 0.000 | 0.000 |
0.000 0.000 | 0.000 |
0.118 0.057 | 0.172 |
||
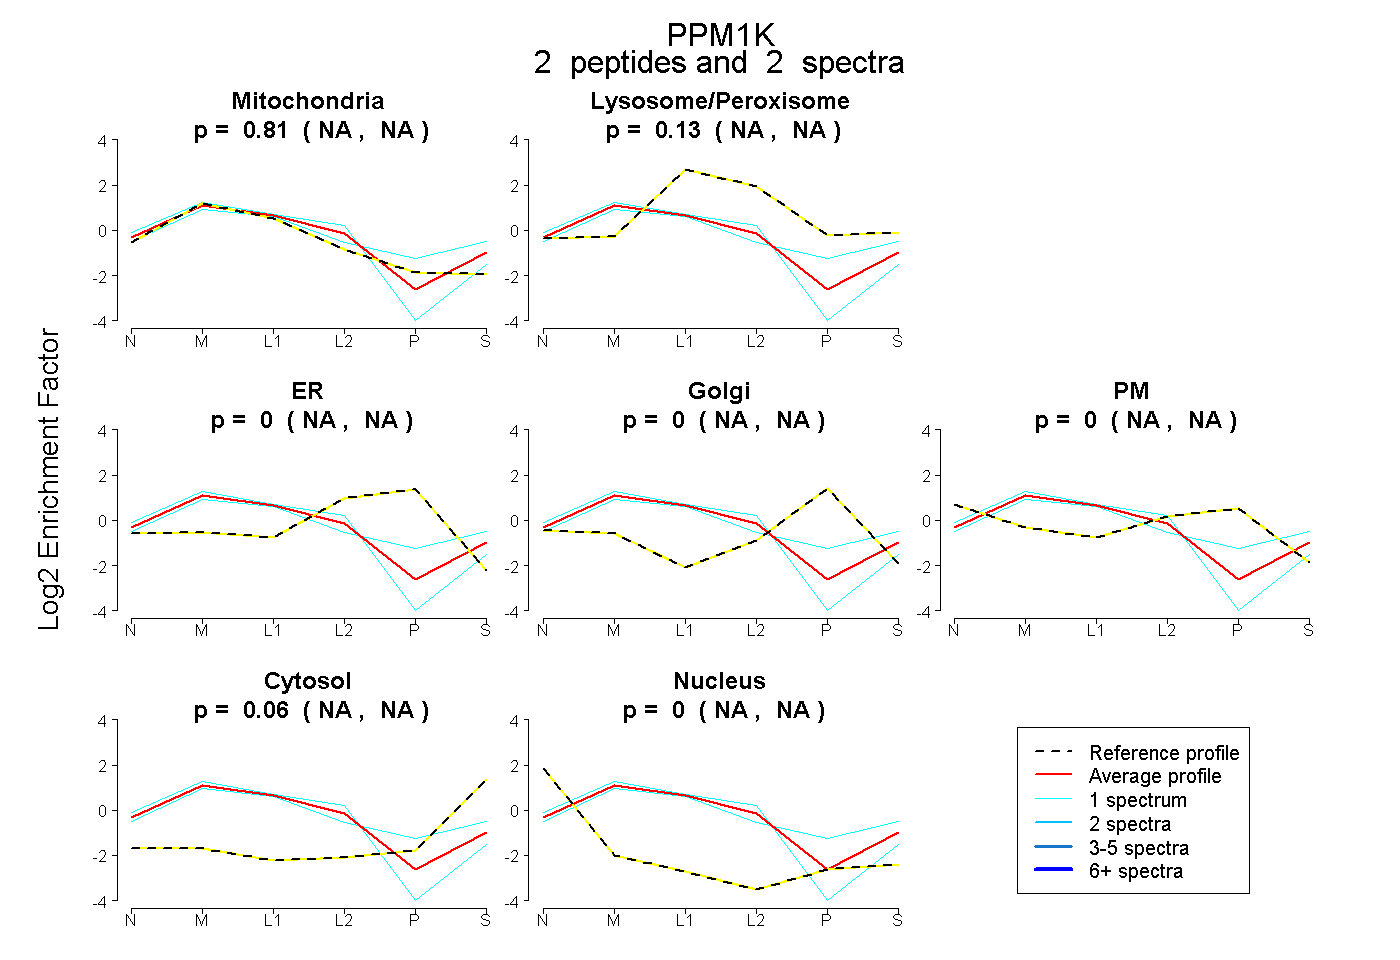
| Plot | Mito | Lyso or Perox | ER | Golgi | PM | Cytosol | Nucleus | ||||||
| Expt B |
2 peptides |
2 spectra |
|
0.806 NA | NA |
0.134 NA | NA |
0.000 NA | NA |
0.000 NA | NA |
0.000 NA | NA |
0.061 NA | NA |
0.000 NA | NA |
| 1 spectrum, LTTDHTPER | 0.973 | 0.027 | 0.000 | 0.000 | 0.000 | 0.000 | 0.000 | |||
| 1 spectrum, CVTDLLPR | 0.601 | 0.239 | 0.000 | 0.000 | 0.000 | 0.160 | 0.000 |
| Plot | Lyso | Other | |||||||||||
| Expt C |
6 peptides |
17 spectra |
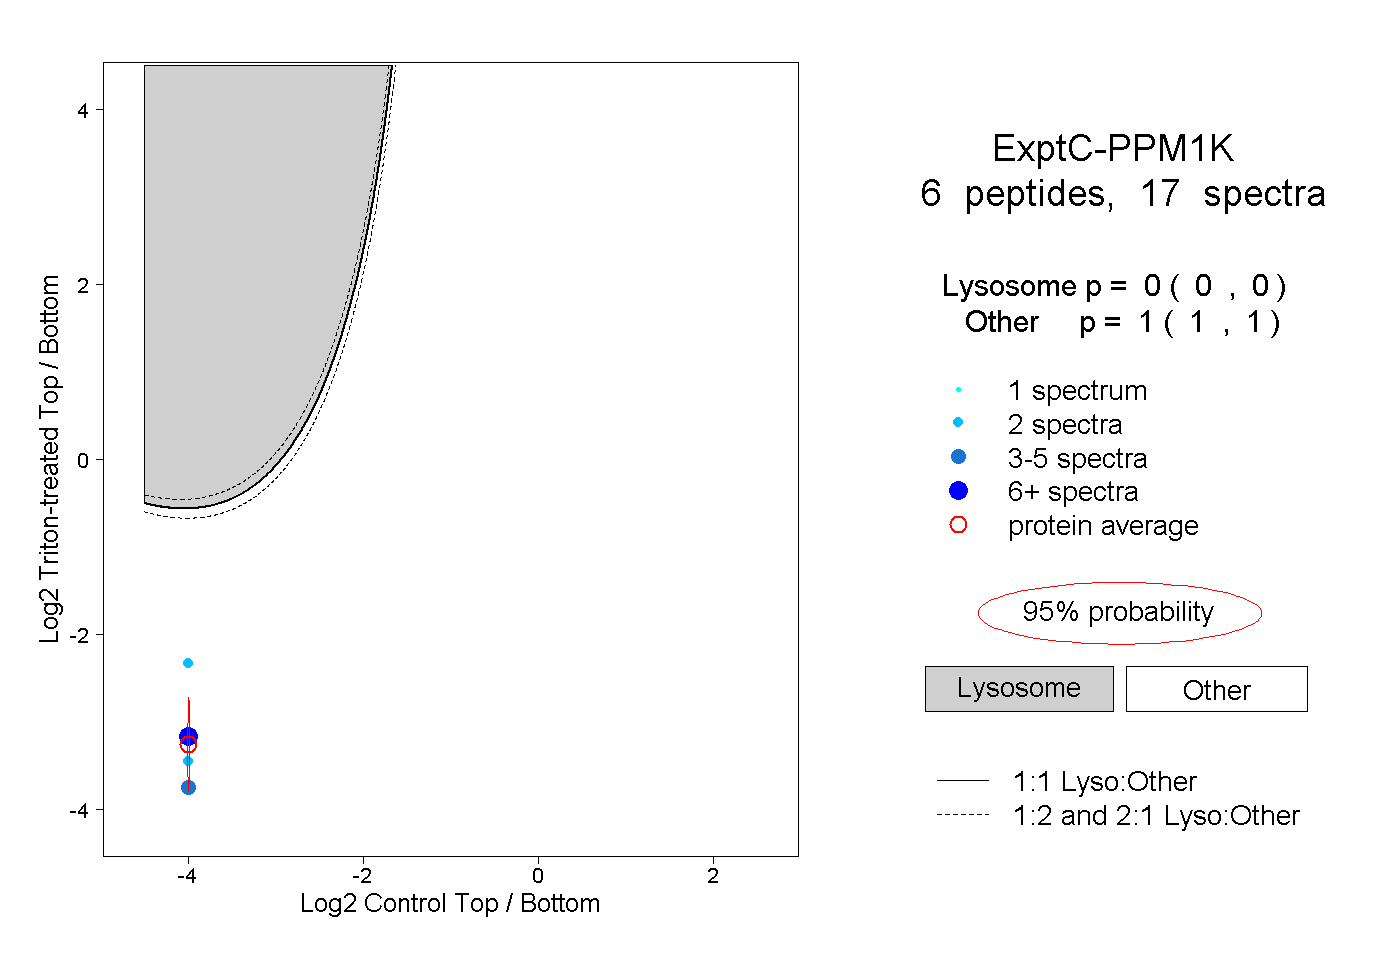 |
0.000 0.000 | 0.000 |
1.000 1.000 | 1.000 |
||||||||
| Plot | Lyso | Other | |||||||||||
| Expt D |
3 peptides |
10 spectra |
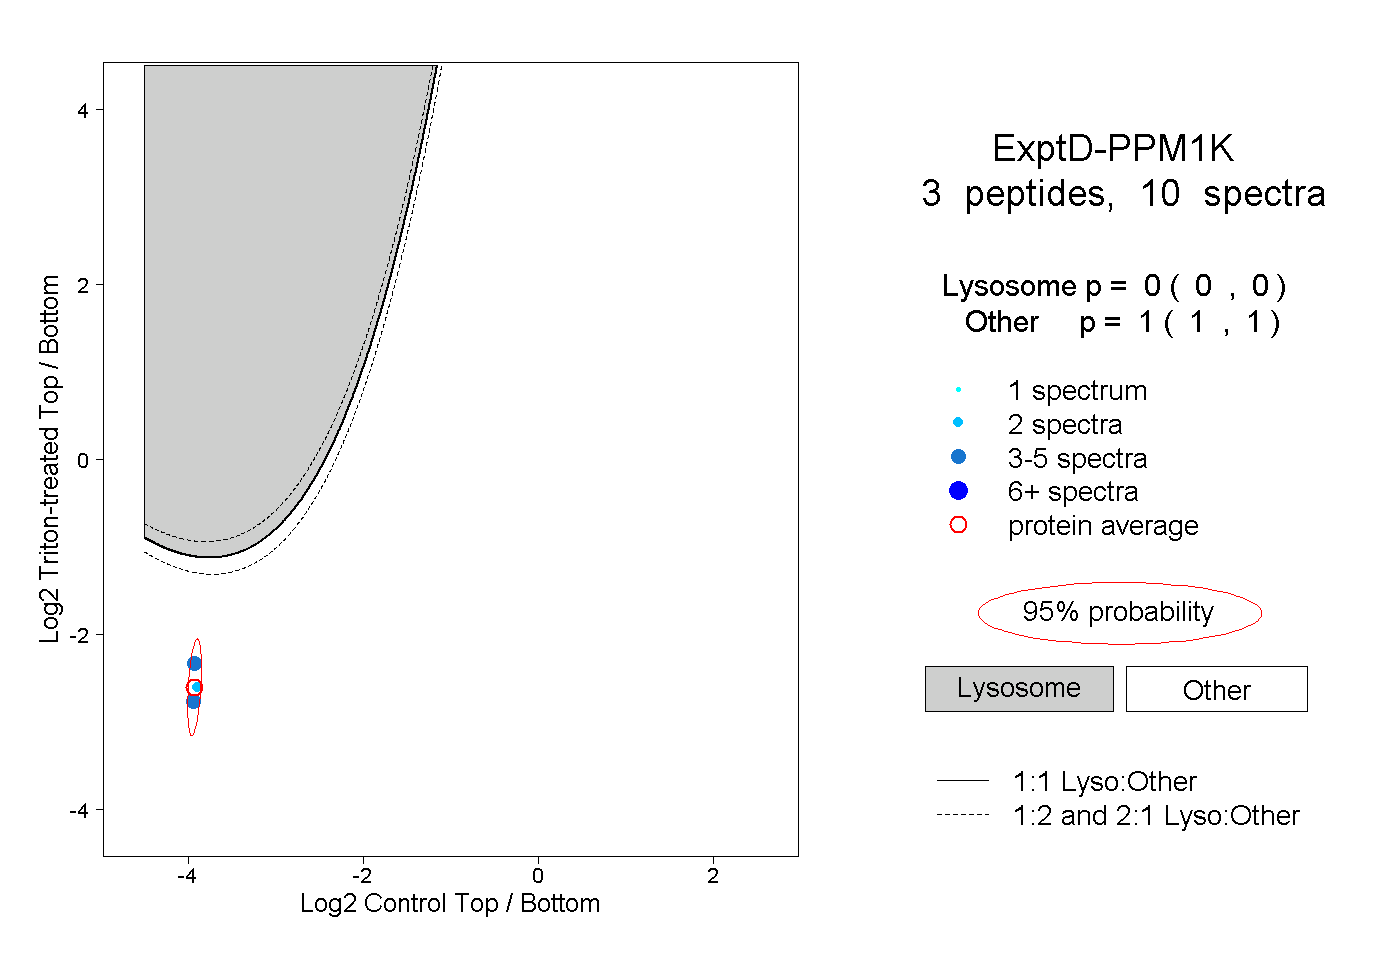 |
0.000 0.000 | 0.000 |
1.000 1.000 | 1.000 |