 45
45peptides
spectra
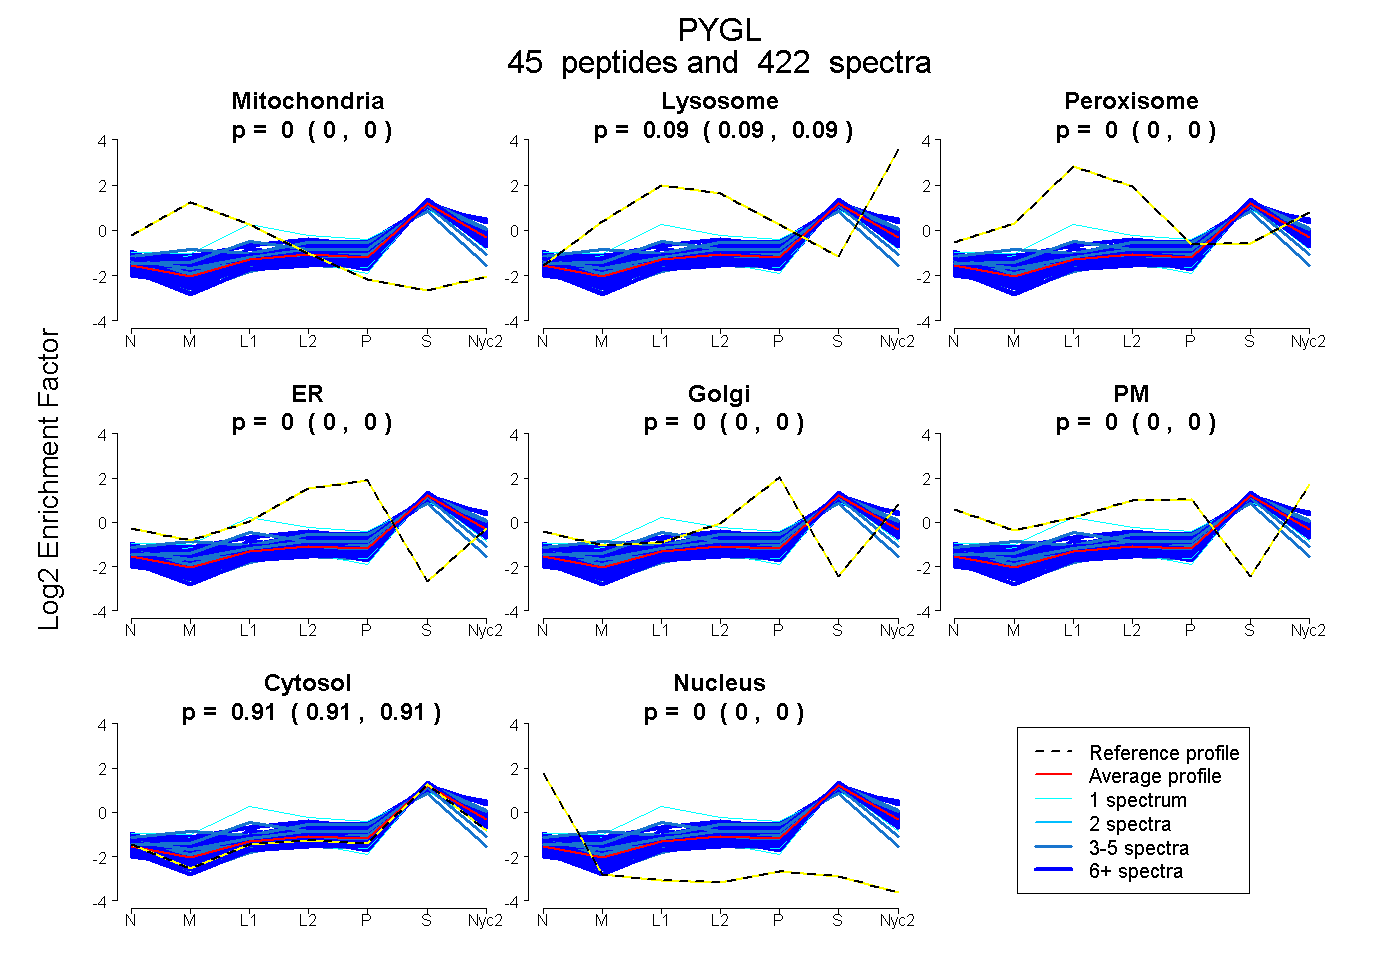
0.000 | 0.000
0.092 | 0.093
0.000 | 0.000
0.000 | 0.000
0.000 | 0.000
0.000 | 0.000
0.907 | 0.908
0.000 | 0.000
43peptides
spectra
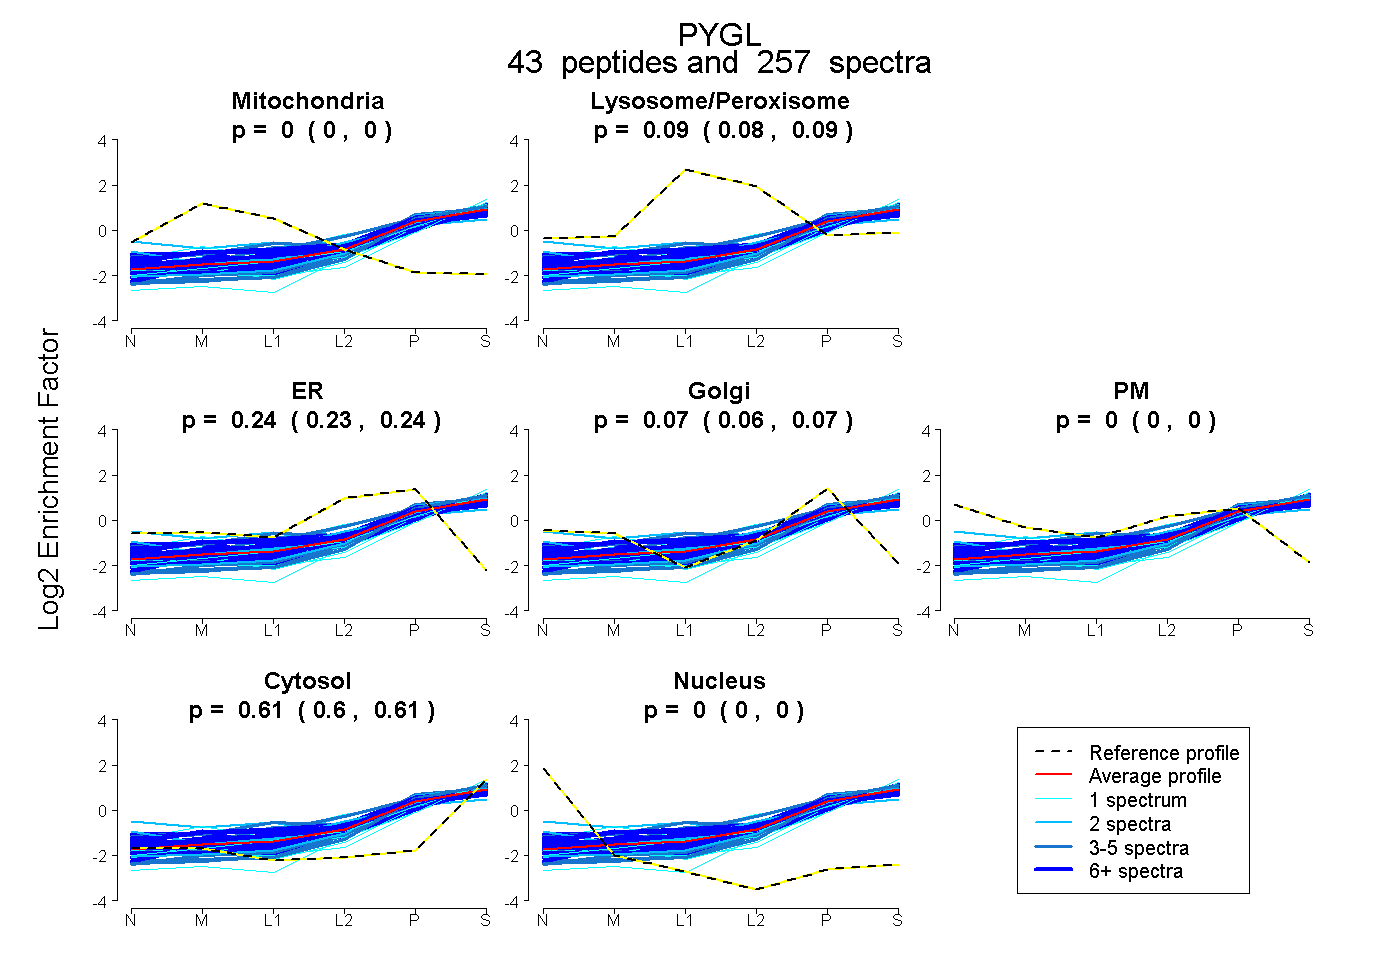
0.000 | 0.000
0.083 | 0.088
0.233 | 0.245
0.064 | 0.075
0.000 | 0.000
0.603 | 0.607
0.000 | 0.000
43peptides
spectra
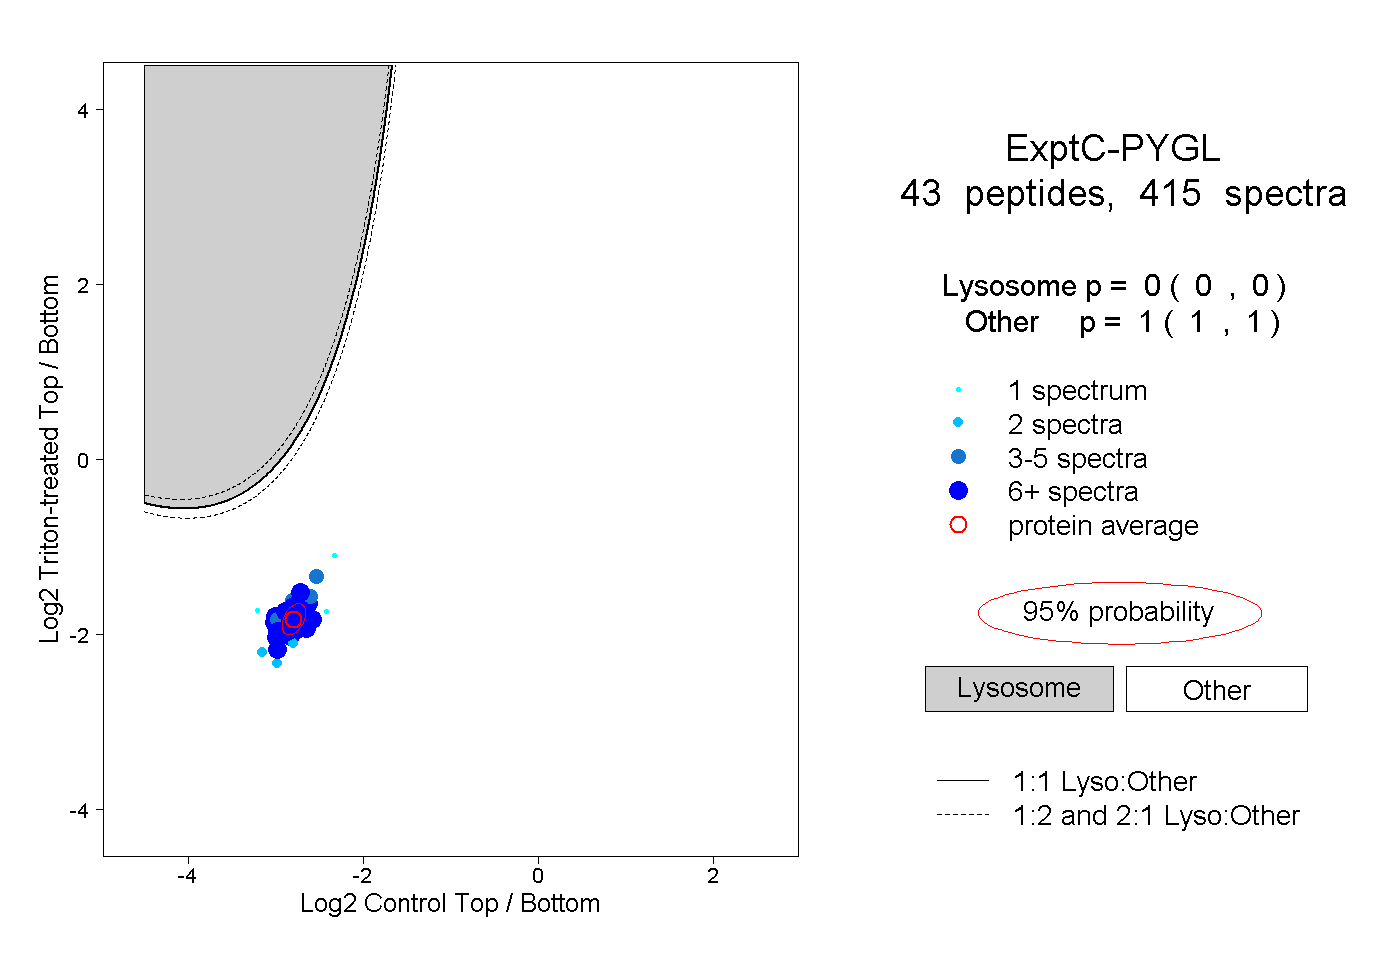
0.000 | 0.000
1.000 | 1.000
20peptides
spectra
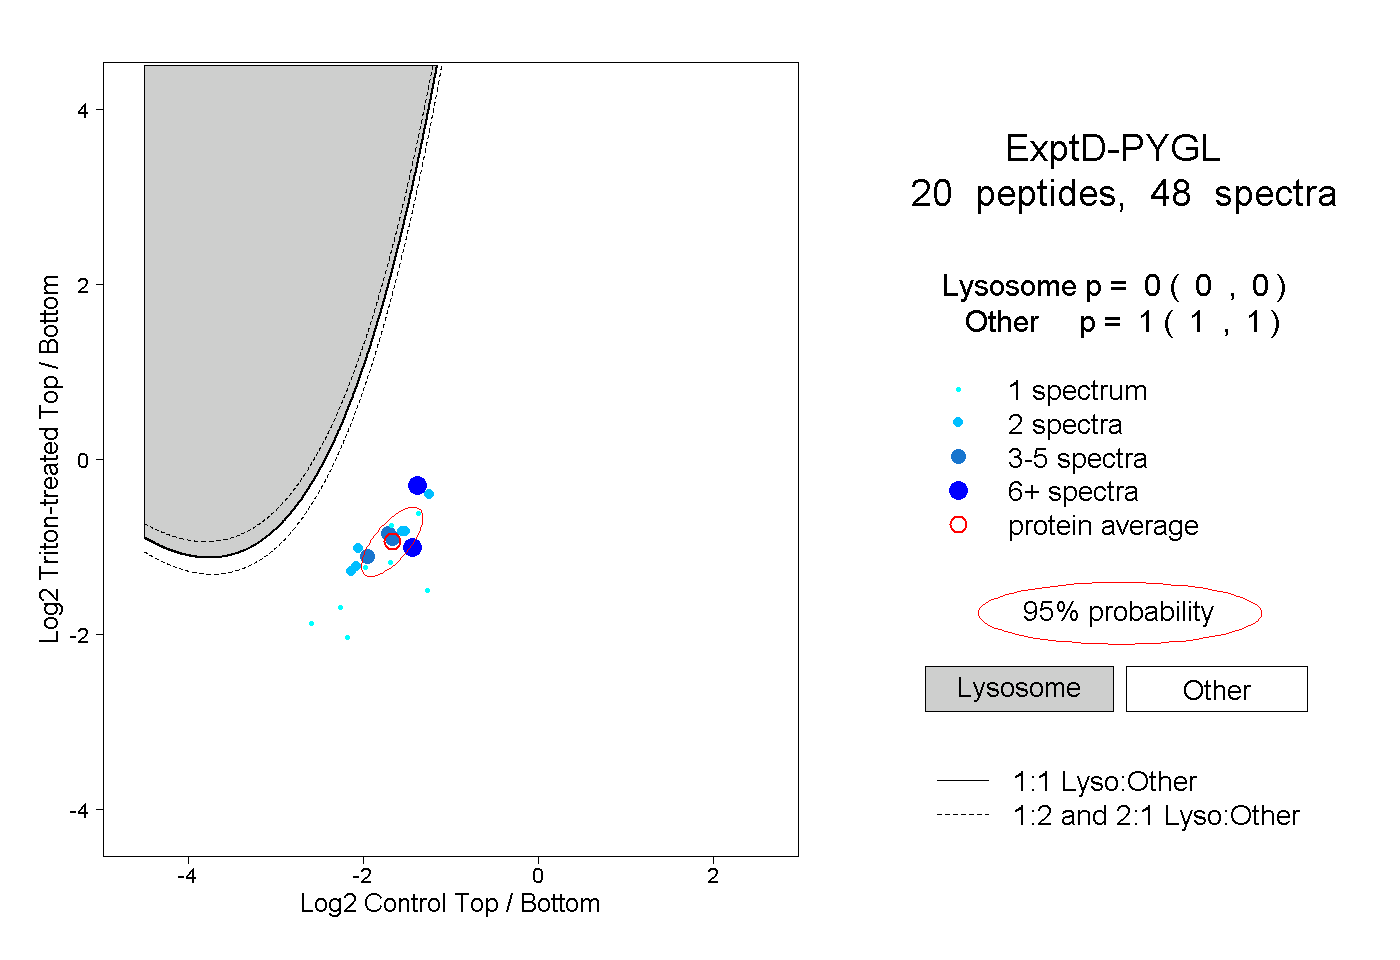
0.000 | 0.000
1.000 | 1.000