13
13peptides
spectra
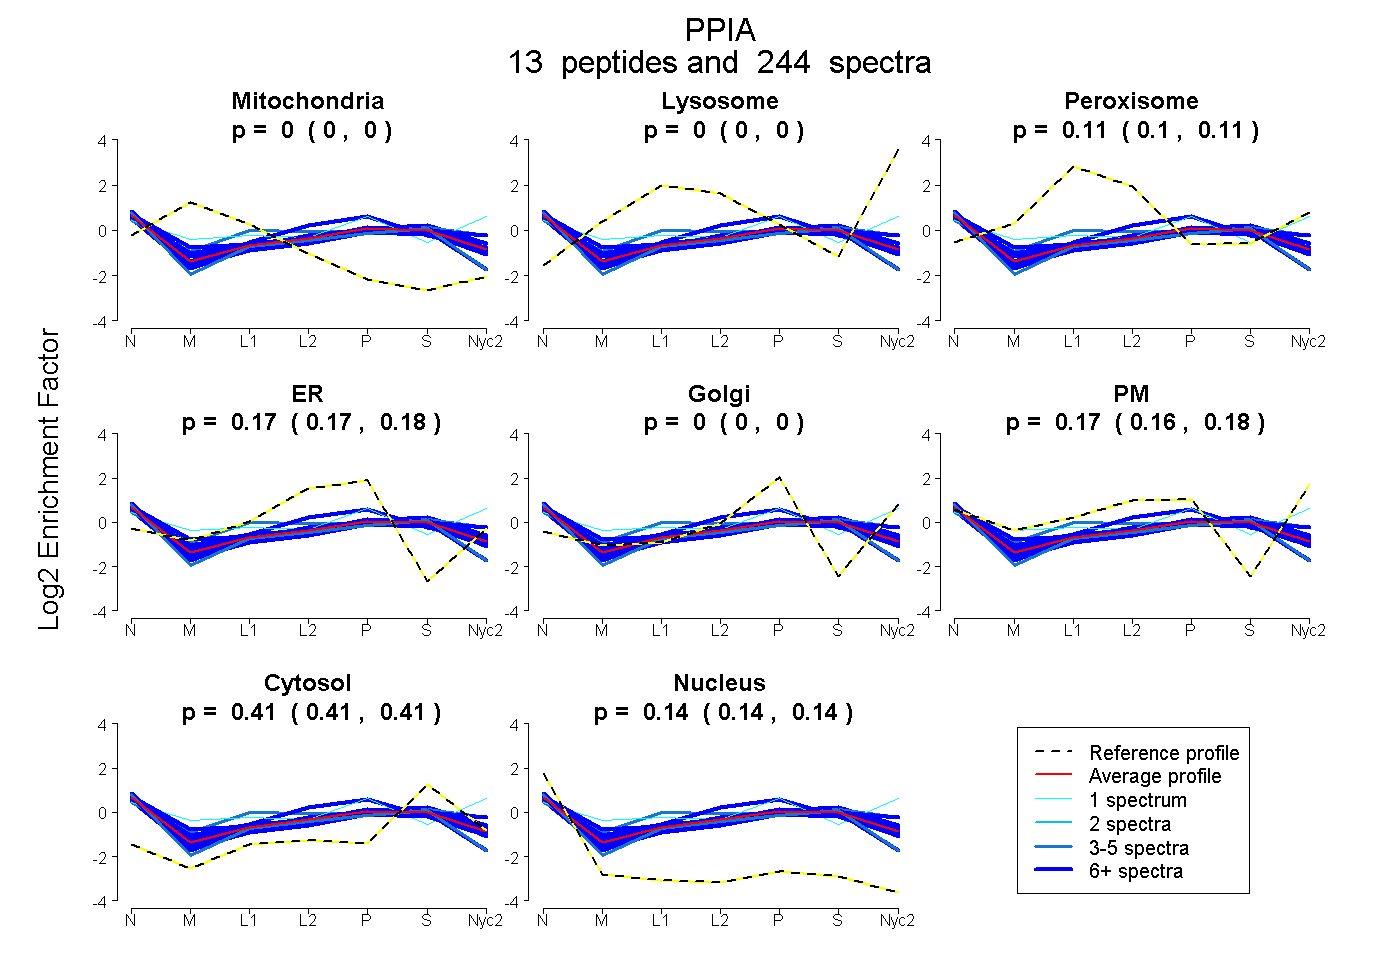
0.000 | 0.000
0.000 | 0.000
0.104 | 0.108
0.168 | 0.177
0.000 | 0.000
0.163 | 0.176
0.408 | 0.411
0.139 | 0.142
6peptides
spectra
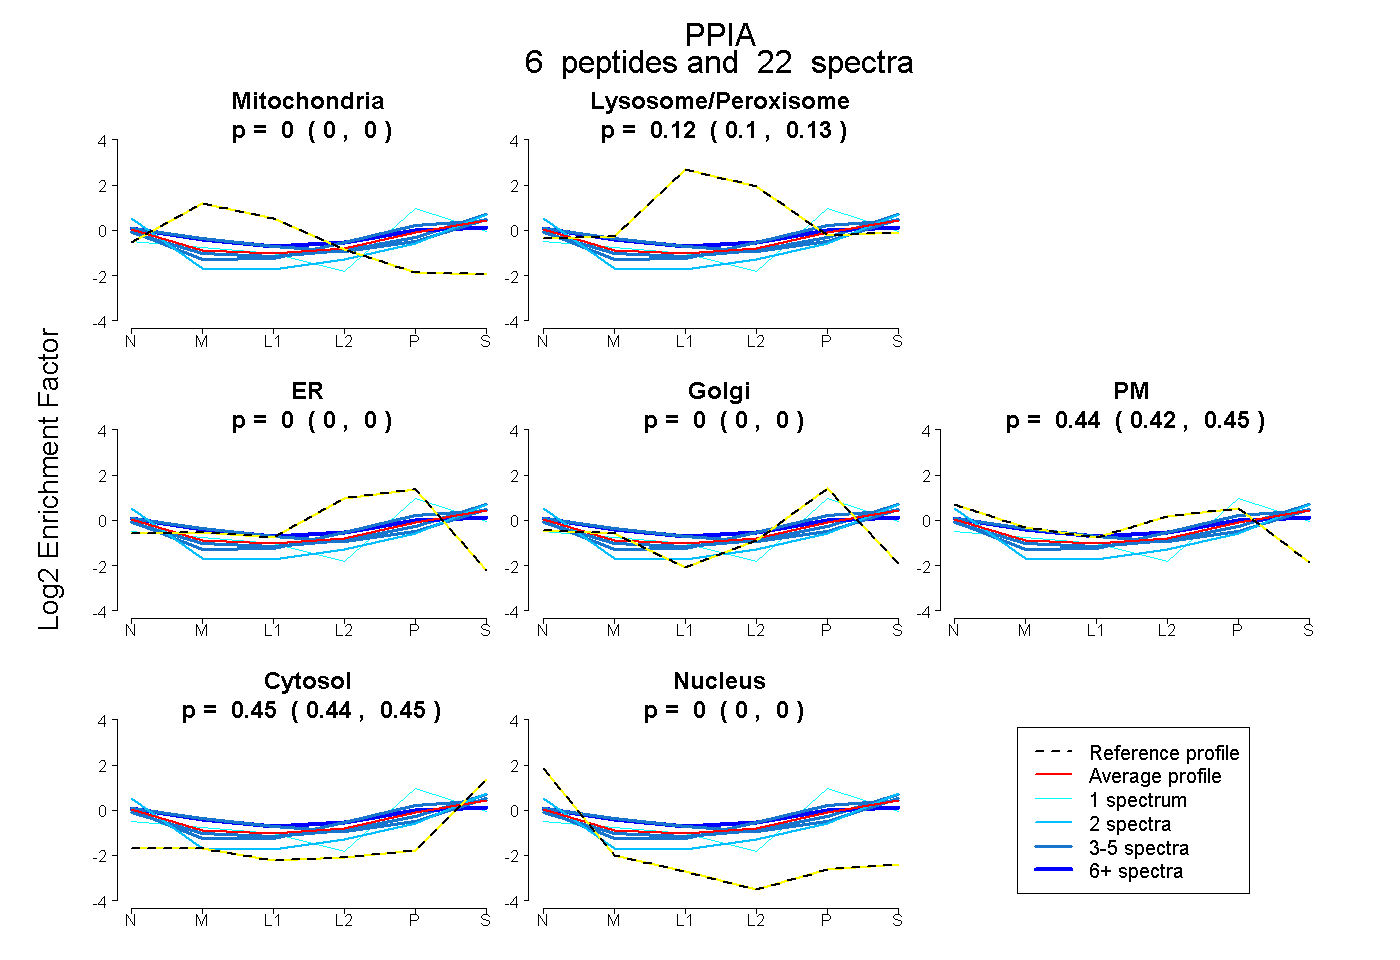
0.000 | 0.000
0.102 | 0.127
0.000 | 0.000
0.000 | 0.000
0.423 | 0.452
0.436 | 0.454
0.000 | 0.000