 13
13peptides
spectra
0.000 | 0.000
0.000 | 0.000
0.104 | 0.108
0.168 | 0.177
0.000 | 0.000
0.163 | 0.176
0.408 | 0.411
0.139 | 0.142
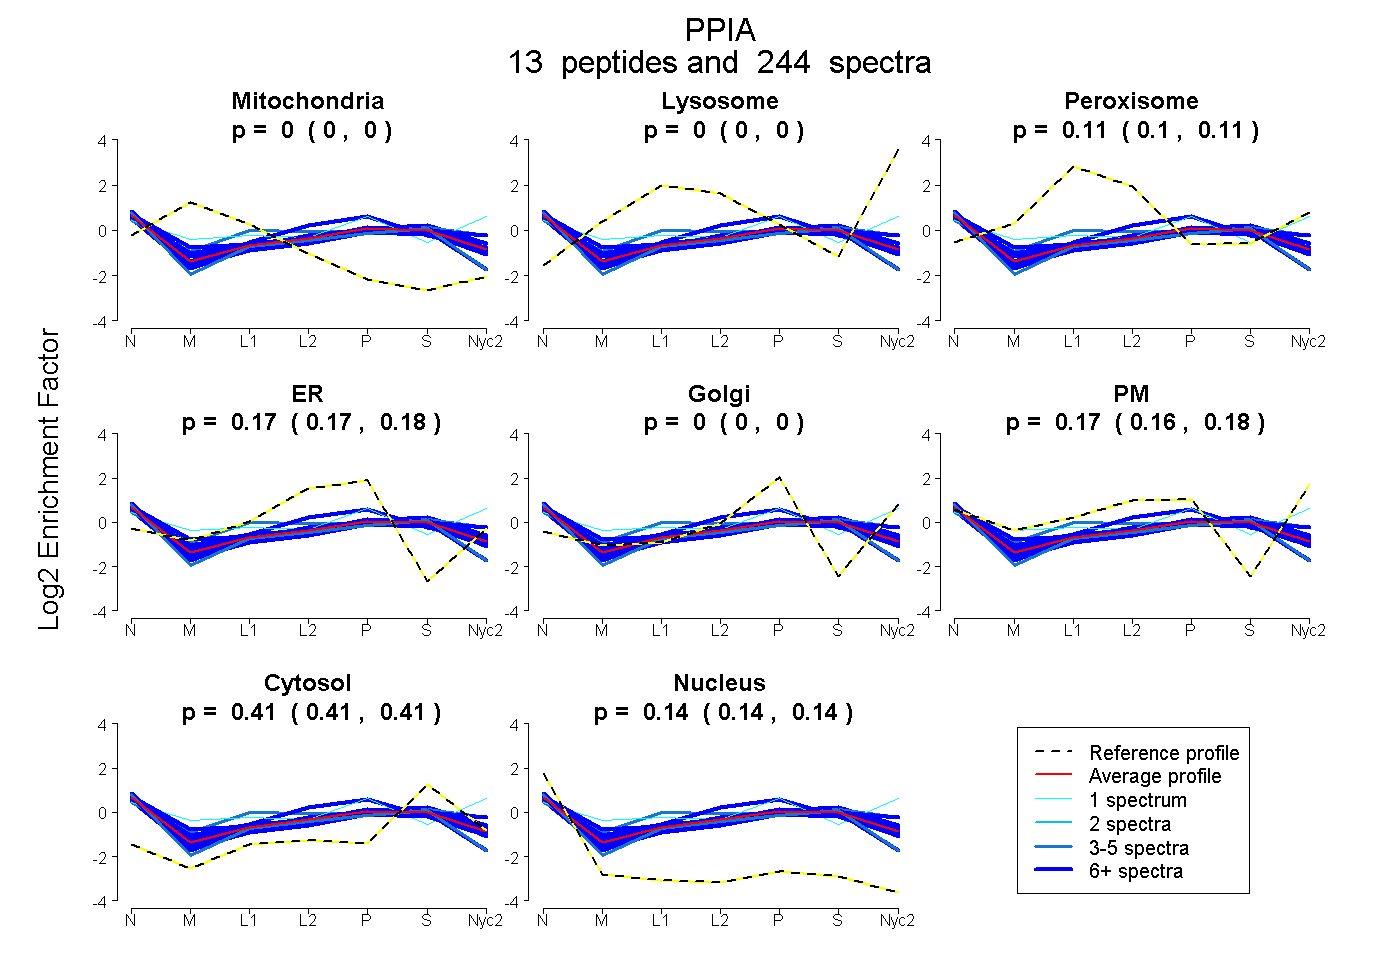
| Plot | Mito | Lyso | Perox | ER | Golgi | PM | Cytosol | Nucleus | |||||
| Expt A |
13 peptides |
244 spectra |
|
0.000 0.000 | 0.000 |
0.000 0.000 | 0.000 |
0.106 0.104 | 0.108 |
0.173 0.168 | 0.177 |
0.000 0.000 | 0.000 |
0.170 0.163 | 0.176 |
0.410 0.408 | 0.411 |
0.141 0.139 | 0.142 |
| 26 spectra, TEWLDGK | 0.000 | 0.000 | 0.109 | 0.000 | 0.000 | 0.377 | 0.412 | 0.102 | ||
| 4 spectra, VNPTVFFDITADGEPLGR | 0.000 | 0.000 | 0.116 | 0.250 | 0.000 | 0.000 | 0.410 | 0.224 | ||
| 42 spectra, TAENFR | 0.022 | 0.000 | 0.175 | 0.158 | 0.000 | 0.141 | 0.323 | 0.180 | ||
| 12 spectra, IIPGFMCQGGDFTR | 0.000 | 0.000 | 0.114 | 0.224 | 0.000 | 0.111 | 0.398 | 0.153 | ||
| 1 spectrum, ITISDCGQL | 0.045 | 0.000 | 0.015 | 0.000 | 0.015 | 0.600 | 0.324 | 0.000 | ||
| 12 spectra, SIYGEK | 0.000 | 0.000 | 0.055 | 0.111 | 0.000 | 0.216 | 0.455 | 0.163 | ||
| 11 spectra, ALSTGEK | 0.000 | 0.000 | 0.064 | 0.237 | 0.000 | 0.108 | 0.440 | 0.152 | ||
| 43 spectra, EGMSIVEAMER | 0.000 | 0.000 | 0.047 | 0.110 | 0.000 | 0.252 | 0.503 | 0.088 | ||
| 6 spectra, HNGTGGK | 0.000 | 0.000 | 0.101 | 0.229 | 0.000 | 0.115 | 0.382 | 0.173 | ||
| 49 spectra, HVVFGK | 0.000 | 0.000 | 0.042 | 0.370 | 0.000 | 0.130 | 0.387 | 0.072 | ||
| 7 spectra, VCFELFADK | 0.000 | 0.000 | 0.151 | 0.266 | 0.000 | 0.000 | 0.364 | 0.219 | ||
| 3 spectra, GSSFHR | 0.000 | 0.000 | 0.252 | 0.000 | 0.000 | 0.282 | 0.387 | 0.079 | ||
| 28 spectra, FEDENFILK | 0.000 | 0.000 | 0.058 | 0.099 | 0.000 | 0.234 | 0.477 | 0.131 |
| Plot | Mito | Lyso or Perox | ER | Golgi | PM | Cytosol | Nucleus | ||||||
| Expt B |
6 peptides |
22 spectra |
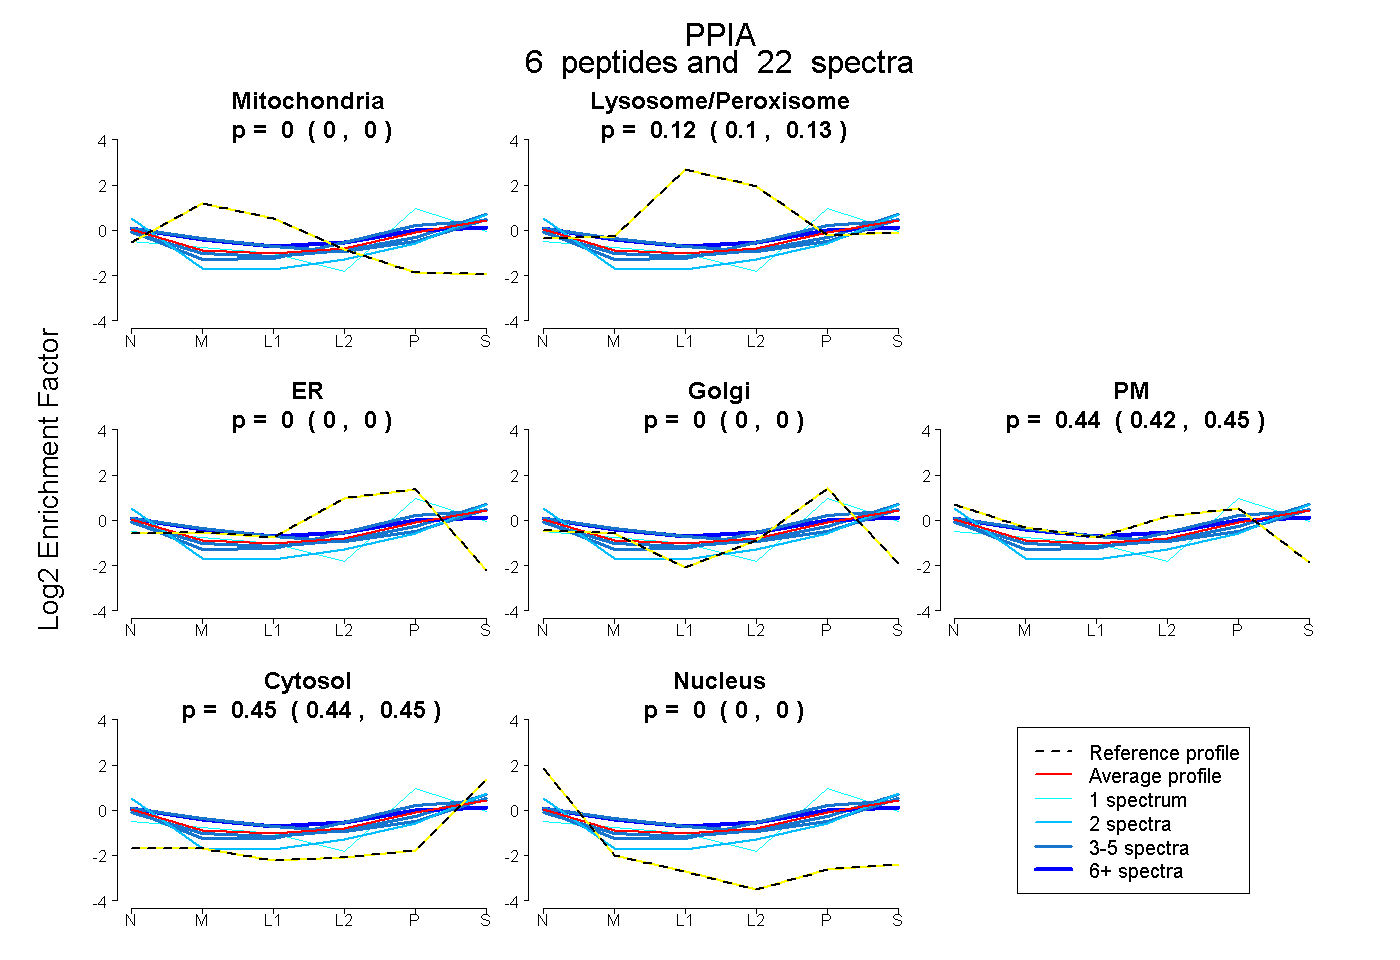 |
0.000 0.000 | 0.000 |
0.116 0.102 | 0.127 |
0.000 0.000 | 0.000 |
0.000 0.000 | 0.000 |
0.439 0.423 | 0.452 |
0.446 0.436 | 0.454 |
0.000 0.000 | 0.000 |
|||
| Plot | Lyso | Other | |||||||||||
| Expt C |
11 peptides |
357 spectra |
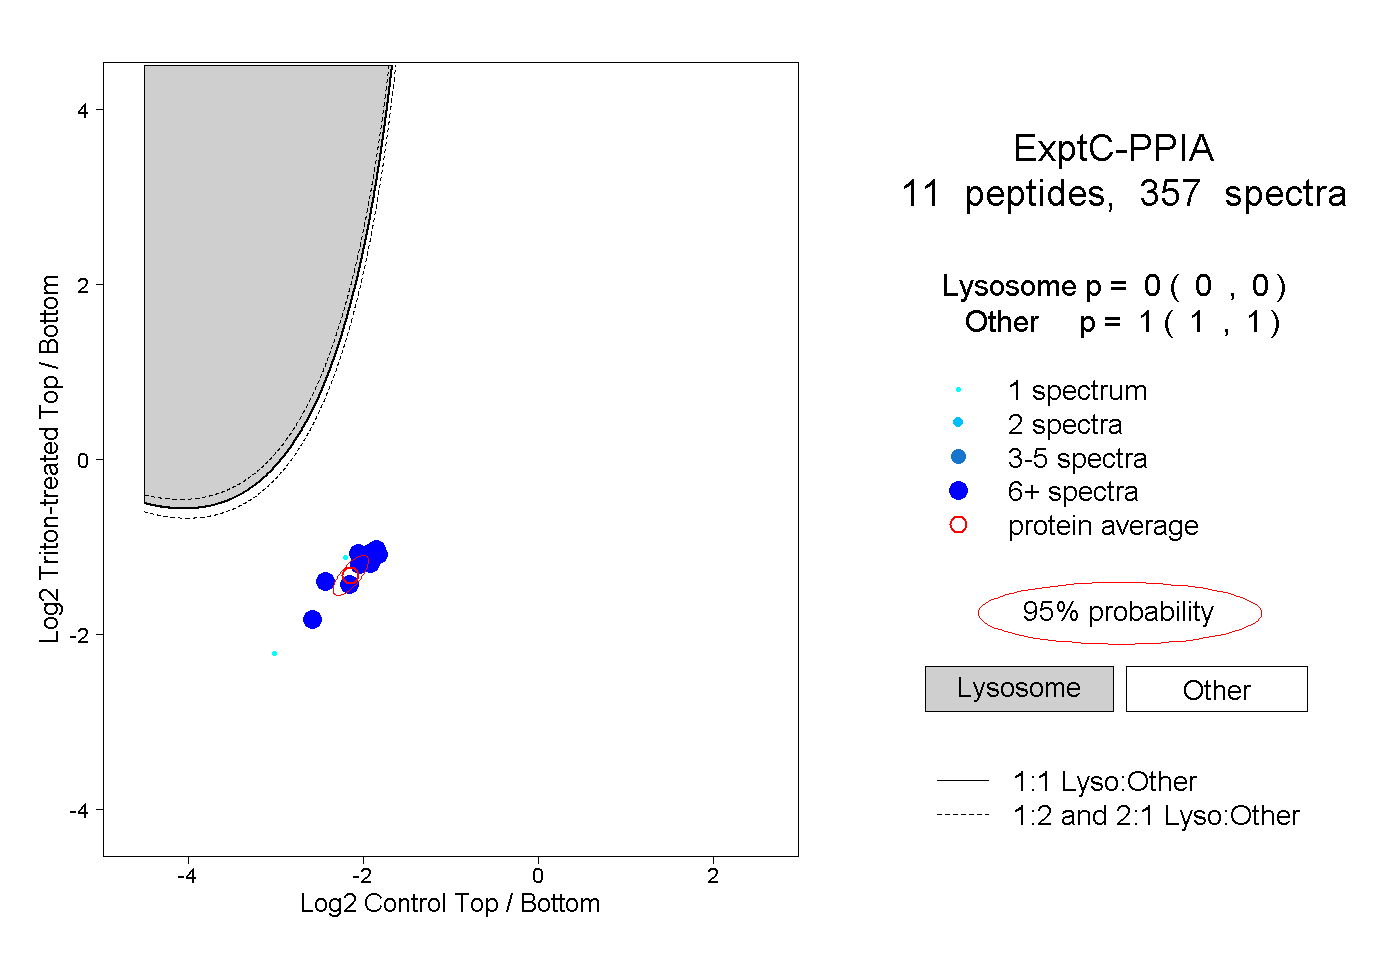 |
0.000 0.000 | 0.000 |
1.000 1.000 | 1.000 |
||||||||
| Plot | Lyso | Other | |||||||||||
| Expt D |
5 peptides |
10 spectra |
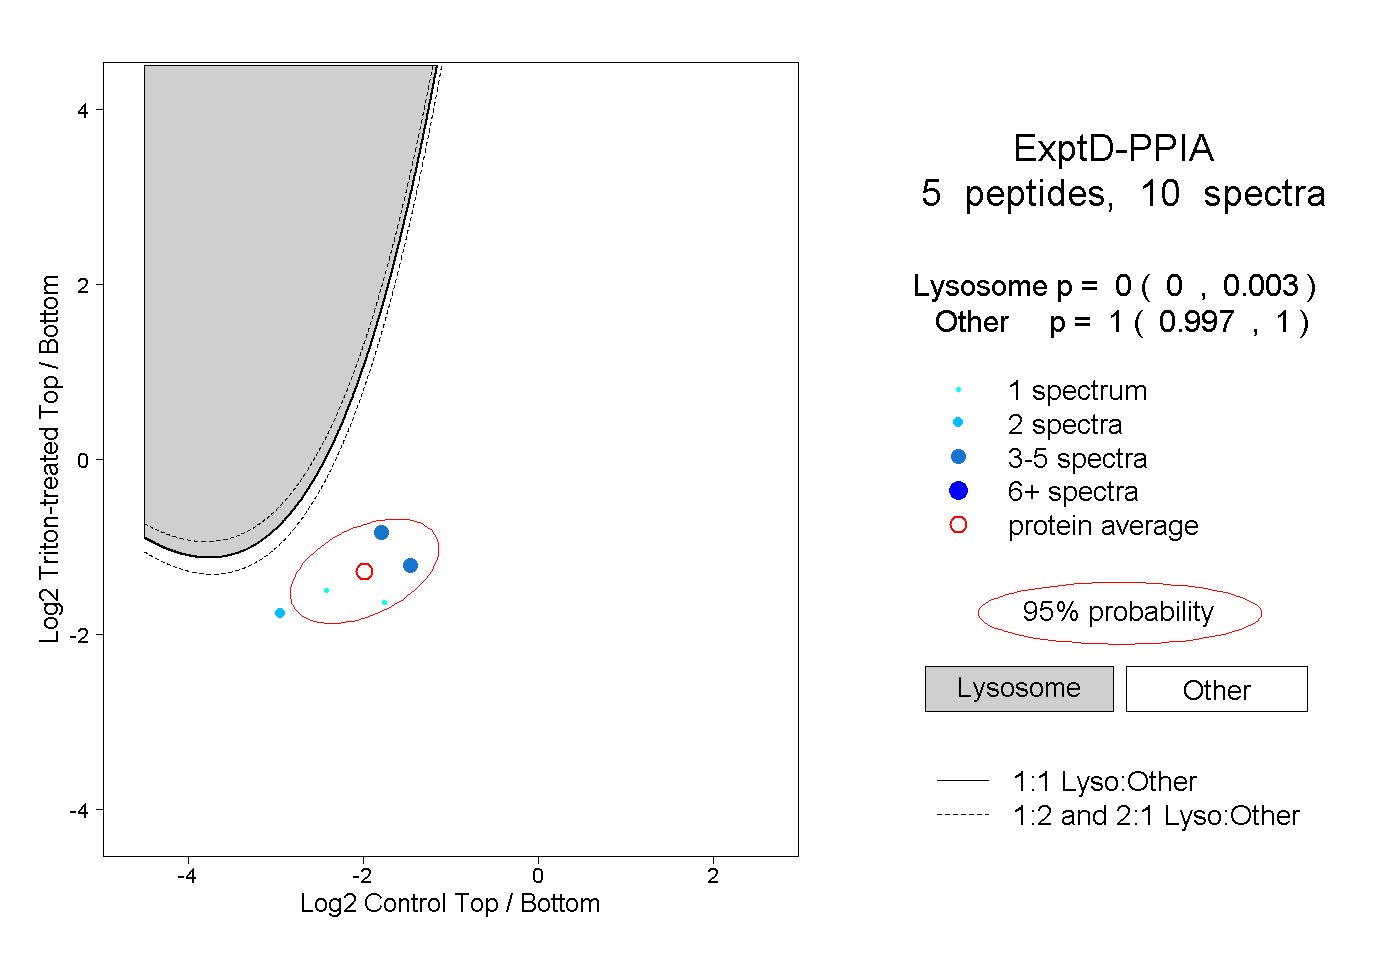 |
0.000 0.000 | 0.003 |
1.000 0.997 | 1.000 |