11
11peptides
spectra
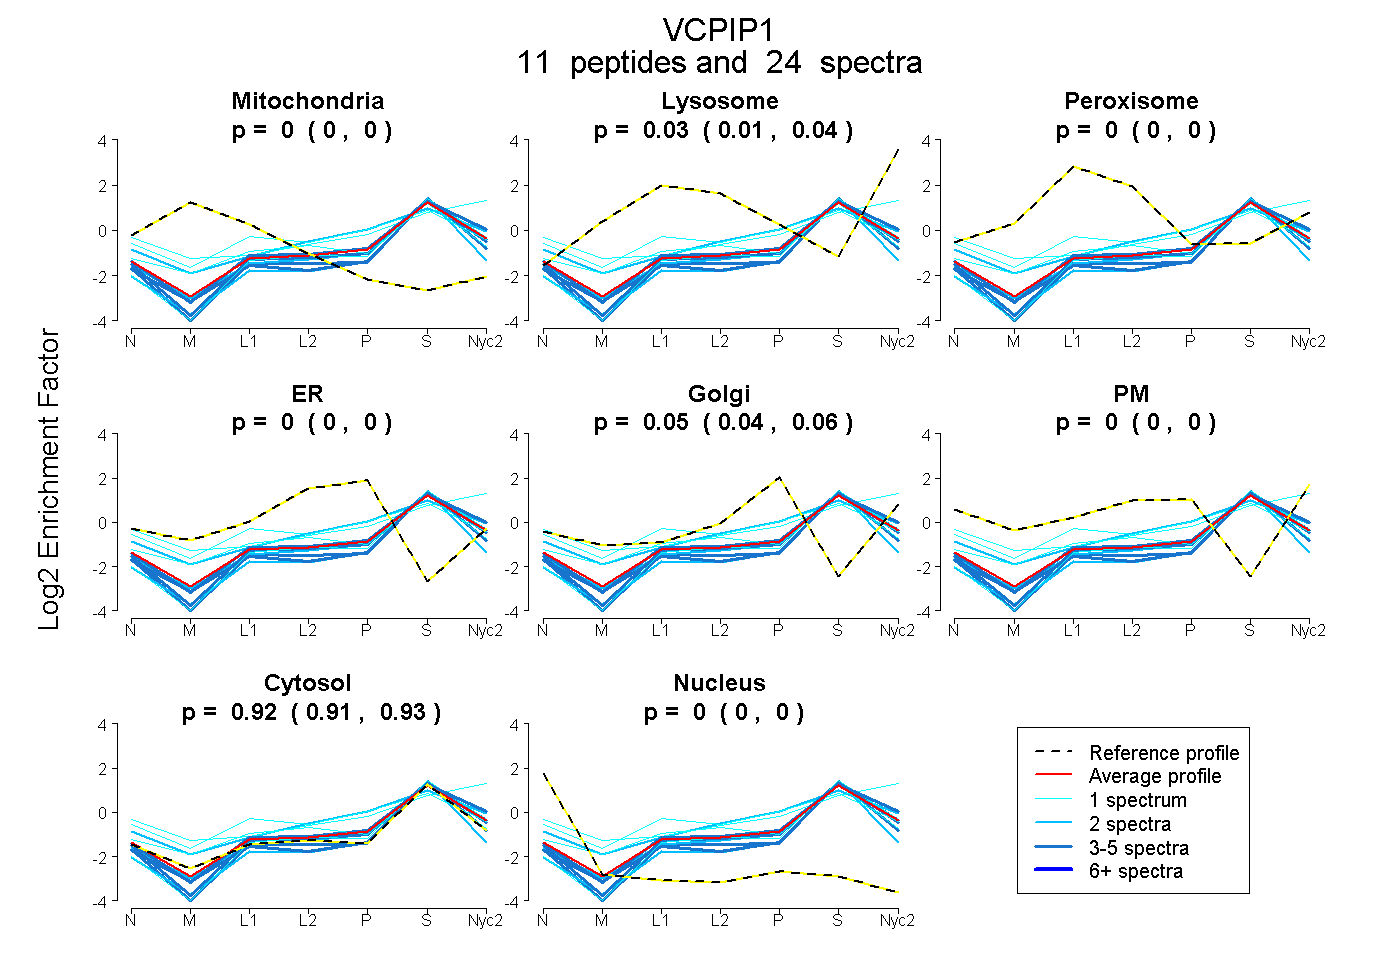
0.000 | 0.000
0.013 | 0.037
0.000 | 0.000
0.000 | 0.000
0.039 | 0.064
0.000 | 0.000
0.911 | 0.930
0.000 | 0.000
3peptides
spectra
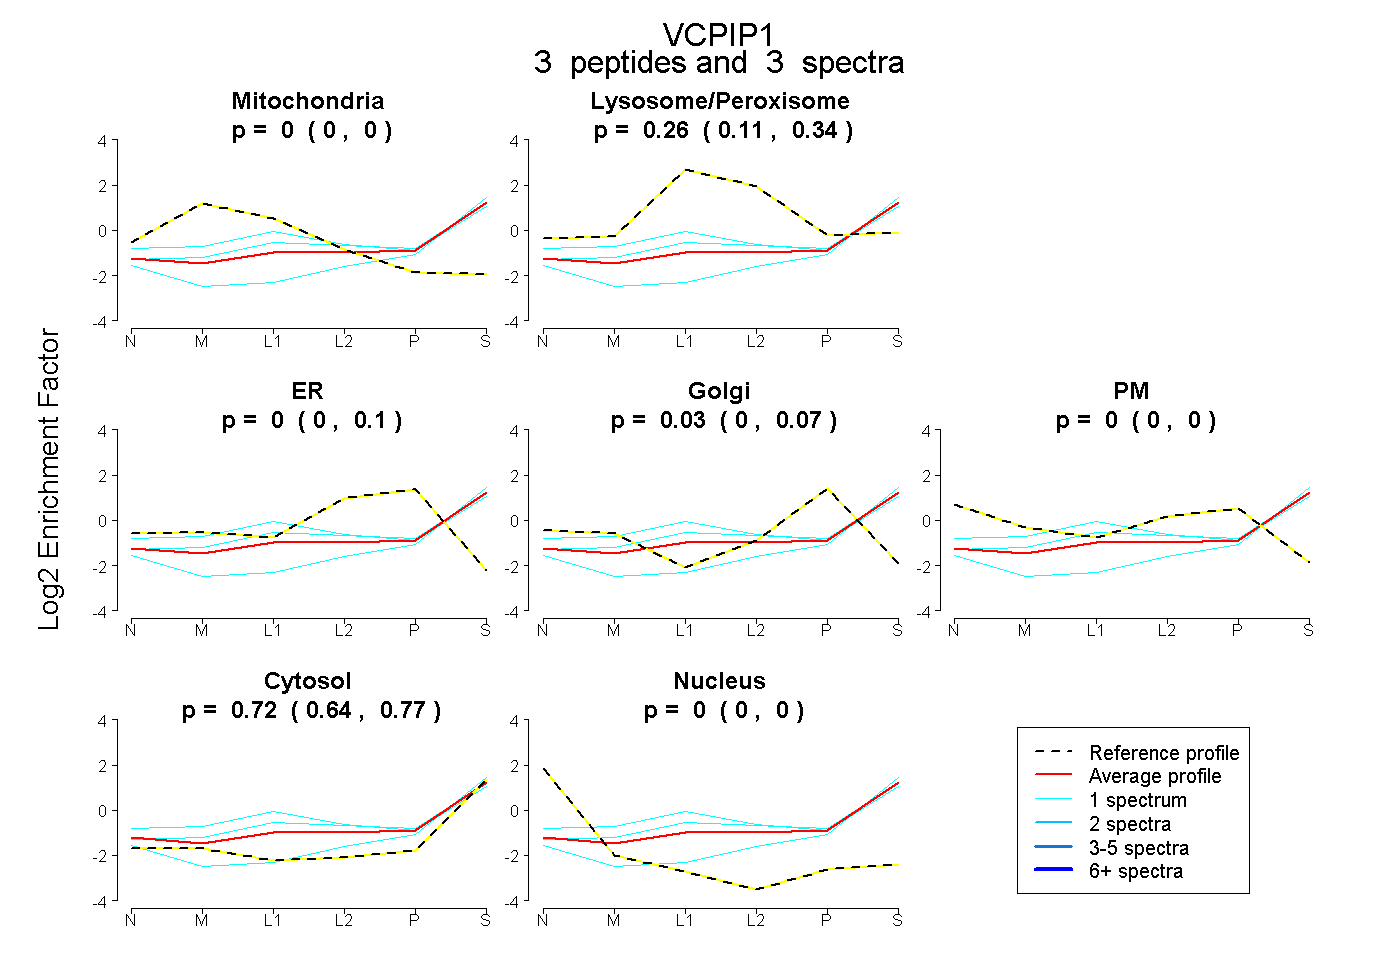
0.000 | 0.000
0.113 | 0.337
0.000 | 0.096
0.000 | 0.074
0.000 | 0.000
0.642 | 0.767
0.000 | 0.000