 11
11peptides
spectra
0.000 | 0.000
0.013 | 0.037
0.000 | 0.000
0.000 | 0.000
0.039 | 0.064
0.000 | 0.000
0.911 | 0.930
0.000 | 0.000
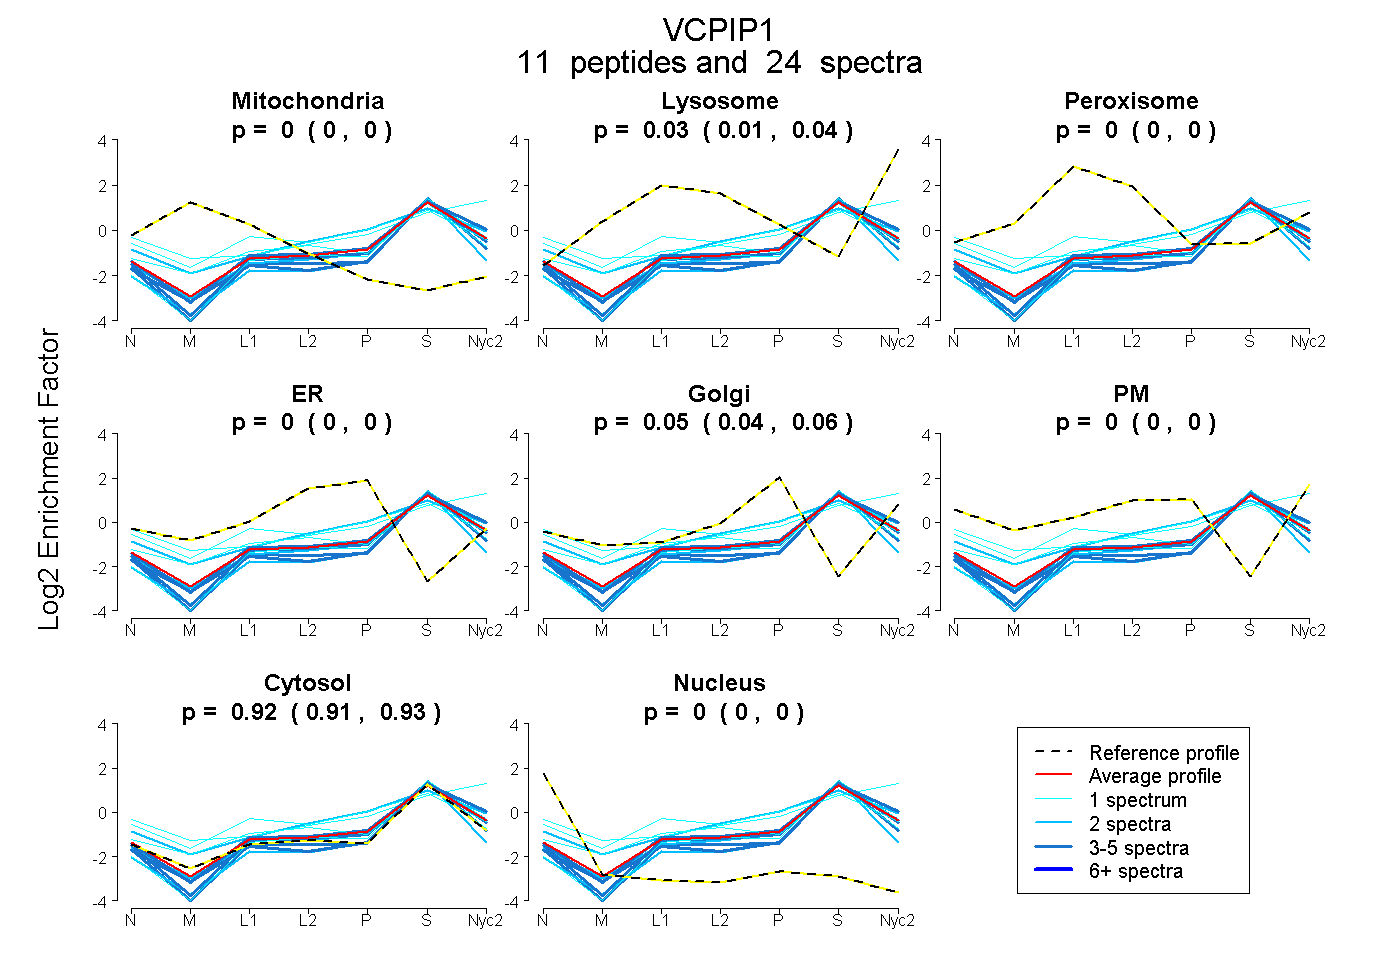
| Plot | Mito | Lyso | Perox | ER | Golgi | PM | Cytosol | Nucleus | |||||
| Expt A |
11 peptides |
24 spectra |
|
0.000 0.000 | 0.000 |
0.026 0.013 | 0.037 |
0.000 0.000 | 0.000 |
0.000 0.000 | 0.000 |
0.053 0.039 | 0.064 |
0.000 0.000 | 0.000 |
0.921 0.911 | 0.930 |
0.000 0.000 | 0.000 |
| 1 spectrum, TIQQNITEQASVMQK | 0.000 | 0.151 | 0.000 | 0.000 | 0.000 | 0.253 | 0.596 | 0.000 | ||
| 3 spectra, LVAAMEEVFMDK | 0.000 | 0.000 | 0.000 | 0.000 | 0.000 | 0.000 | 1.000 | 0.000 | ||
| 2 spectra, HFWEGK | 0.000 | 0.000 | 0.000 | 0.000 | 0.026 | 0.000 | 0.974 | 0.000 | ||
| 2 spectra, LYNLAK | 0.000 | 0.075 | 0.000 | 0.014 | 0.190 | 0.020 | 0.701 | 0.000 | ||
| 1 spectrum, VVHTILHQTAK | 0.000 | 0.000 | 0.133 | 0.027 | 0.000 | 0.000 | 0.840 | 0.000 | ||
| 3 spectra, TVSPSTIR | 0.000 | 0.066 | 0.000 | 0.000 | 0.023 | 0.000 | 0.912 | 0.000 | ||
| 1 spectrum, QIDPDVVEAQR | 0.000 | 0.000 | 0.000 | 0.000 | 0.000 | 0.000 | 1.000 | 0.000 | ||
| 4 spectra, ELFWHALR | 0.000 | 0.000 | 0.000 | 0.000 | 0.000 | 0.000 | 1.000 | 0.000 | ||
| 1 spectrum, STHGQLRPDK | 0.000 | 0.000 | 0.203 | 0.006 | 0.175 | 0.000 | 0.616 | 0.000 | ||
| 2 spectra, LEEDGGCVIGGDR | 0.000 | 0.000 | 0.000 | 0.000 | 0.000 | 0.000 | 0.985 | 0.015 | ||
| 4 spectra, LLSPILAR | 0.000 | 0.000 | 0.000 | 0.000 | 0.000 | 0.000 | 1.000 | 0.000 |
| Plot | Mito | Lyso or Perox | ER | Golgi | PM | Cytosol | Nucleus | ||||||
| Expt B |
3 peptides |
3 spectra |
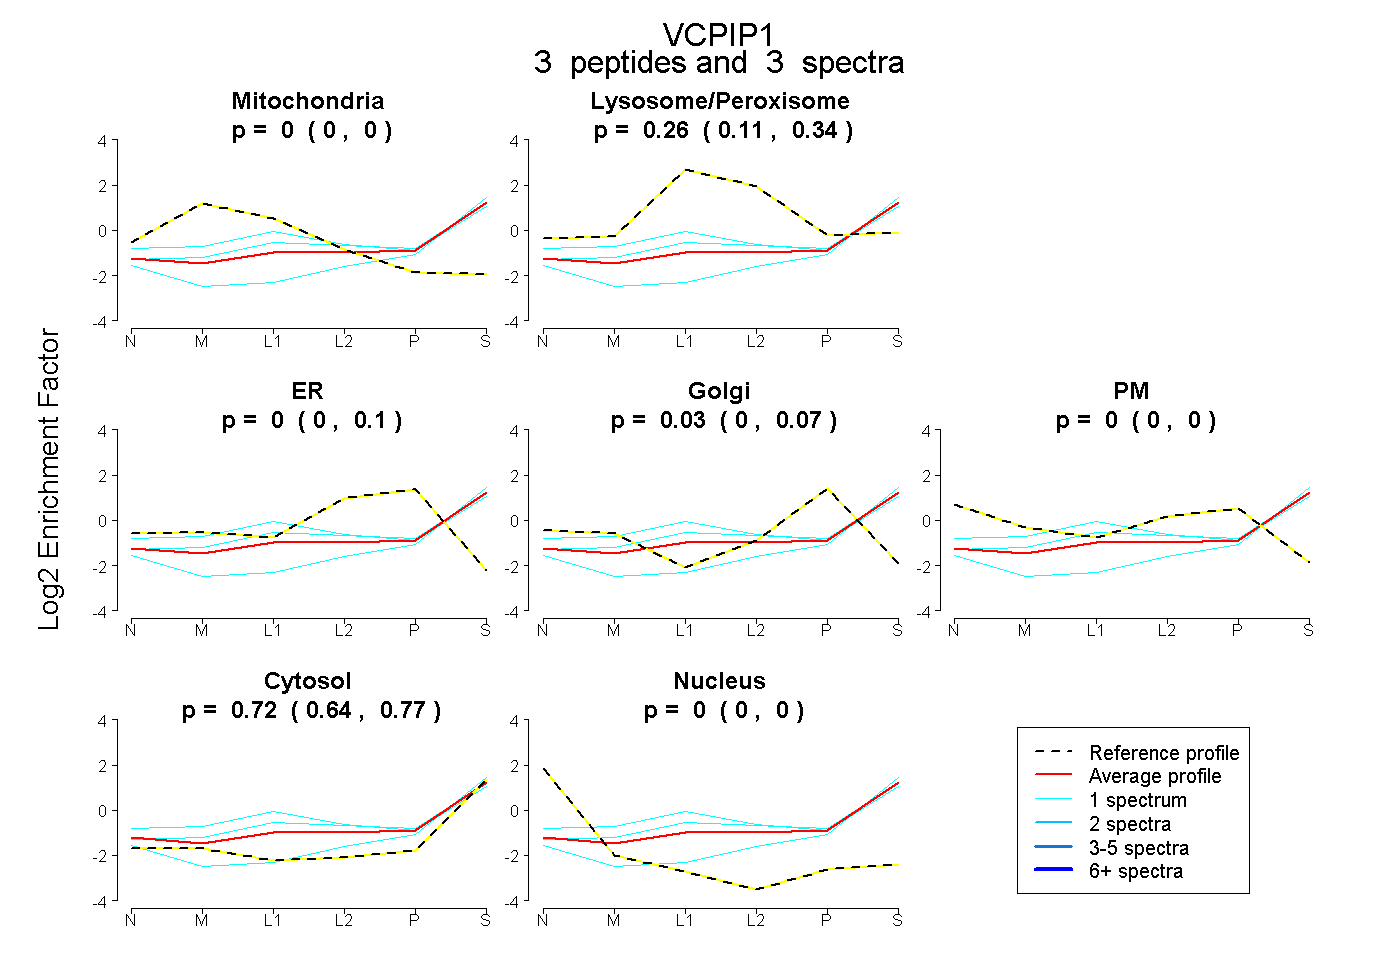 |
0.000 0.000 | 0.000 |
0.258 0.113 | 0.337 |
0.000 0.000 | 0.096 |
0.027 0.000 | 0.074 |
0.000 0.000 | 0.000 |
0.715 0.642 | 0.767 |
0.000 0.000 | 0.000 |
|||
| Plot | Lyso | Other | |||||||||||
| Expt C |
7 peptides |
39 spectra |
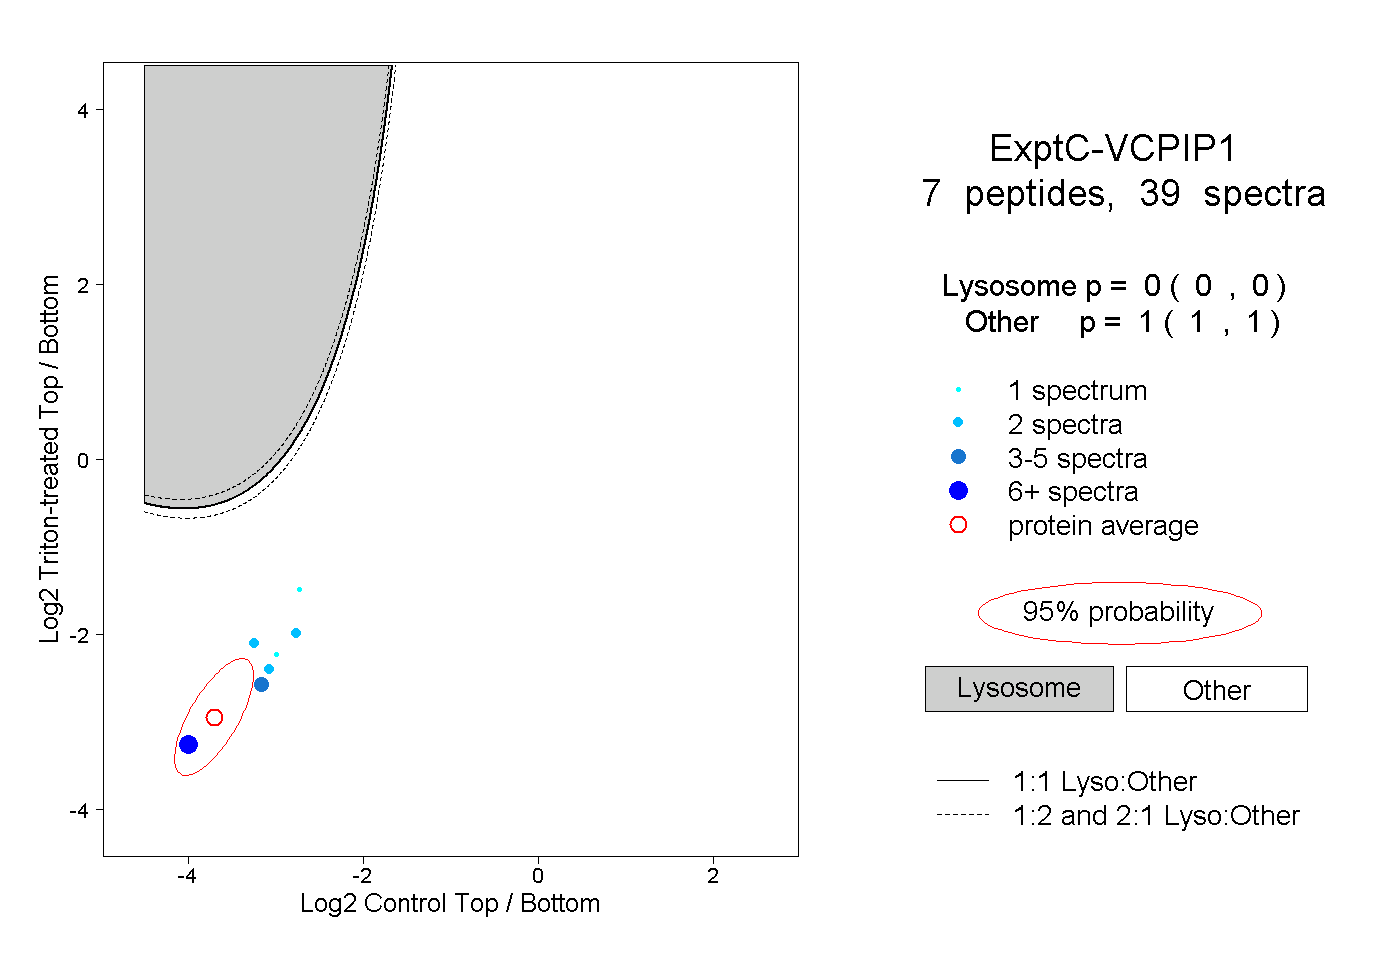 |
0.000 0.000 | 0.000 |
1.000 1.000 | 1.000 |
||||||||
| Plot | Lyso | Other | |||||||||||
| Expt D |
1 peptide |
2 spectra |
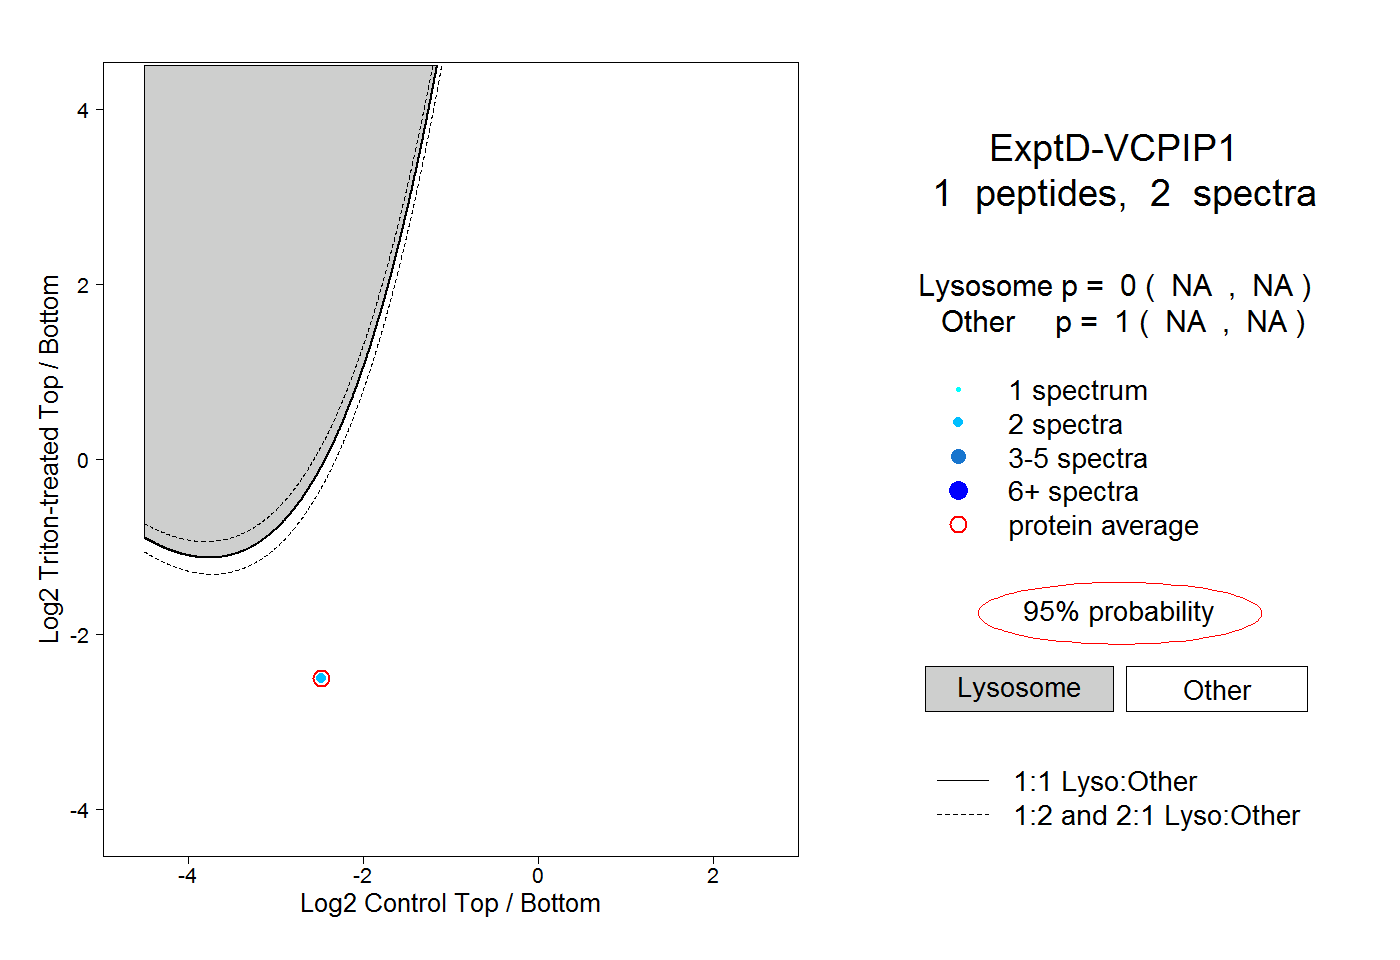 |
0.000 NA | NA |
1.000 NA | NA |