 3
3peptides
spectra
0.166 | 0.266
0.000 | 0.000
0.000 | 0.034
0.260 | 0.313
0.000 | 0.000
0.000 | 0.000
0.432 | 0.507
0.000 | 0.023
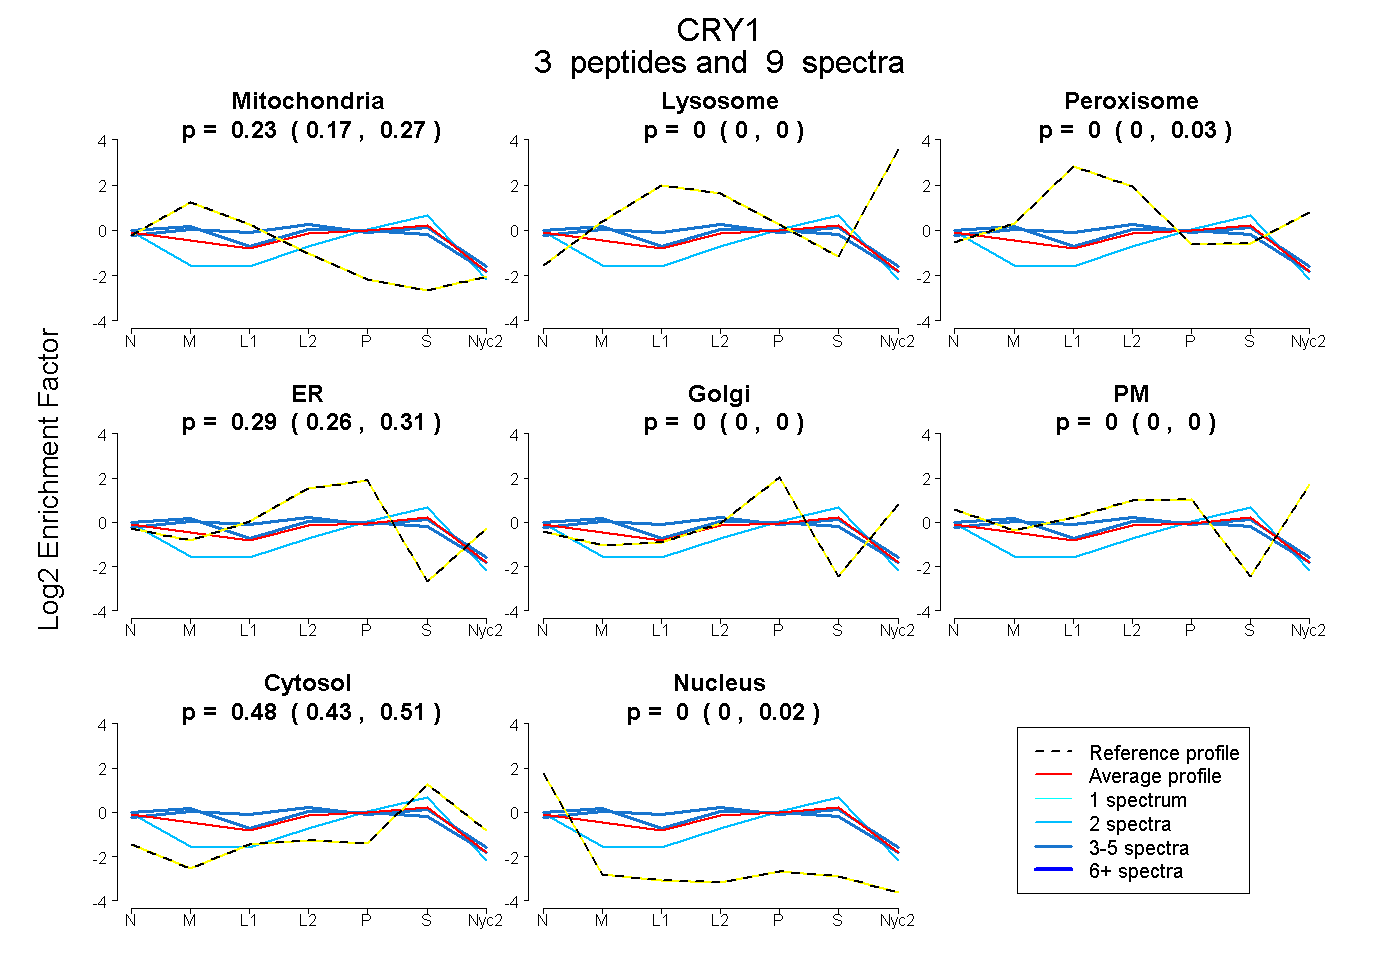
| Plot | Mito | Lyso | Perox | ER | Golgi | PM | Cytosol | Nucleus | |||||
| Expt A |
3 peptides |
9 spectra |
|
0.231 0.166 | 0.266 |
0.000 0.000 | 0.000 |
0.000 0.000 | 0.034 |
0.293 0.260 | 0.313 |
0.000 0.000 | 0.000 |
0.000 0.000 | 0.000 |
0.477 0.432 | 0.507 |
0.000 0.000 | 0.023 |
| 4 spectra, HAVACFLTR | 0.324 | 0.000 | 0.004 | 0.320 | 0.000 | 0.000 | 0.352 | 0.000 | ||
| 3 spectra, GVNAVHWFR | 0.240 | 0.000 | 0.177 | 0.220 | 0.000 | 0.000 | 0.364 | 0.000 | ||
| 2 spectra, FGCLSCR | 0.000 | 0.000 | 0.000 | 0.244 | 0.000 | 0.000 | 0.609 | 0.147 |