 9
9peptides
spectra
0.000 | 0.000
0.000 | 0.031
0.000 | 0.030
0.000 | 0.000
0.000 | 0.000
0.127 | 0.162
0.820 | 0.853
0.000 | 0.000
7peptides
spectra
0.000 | 0.000
1.000 | 1.000
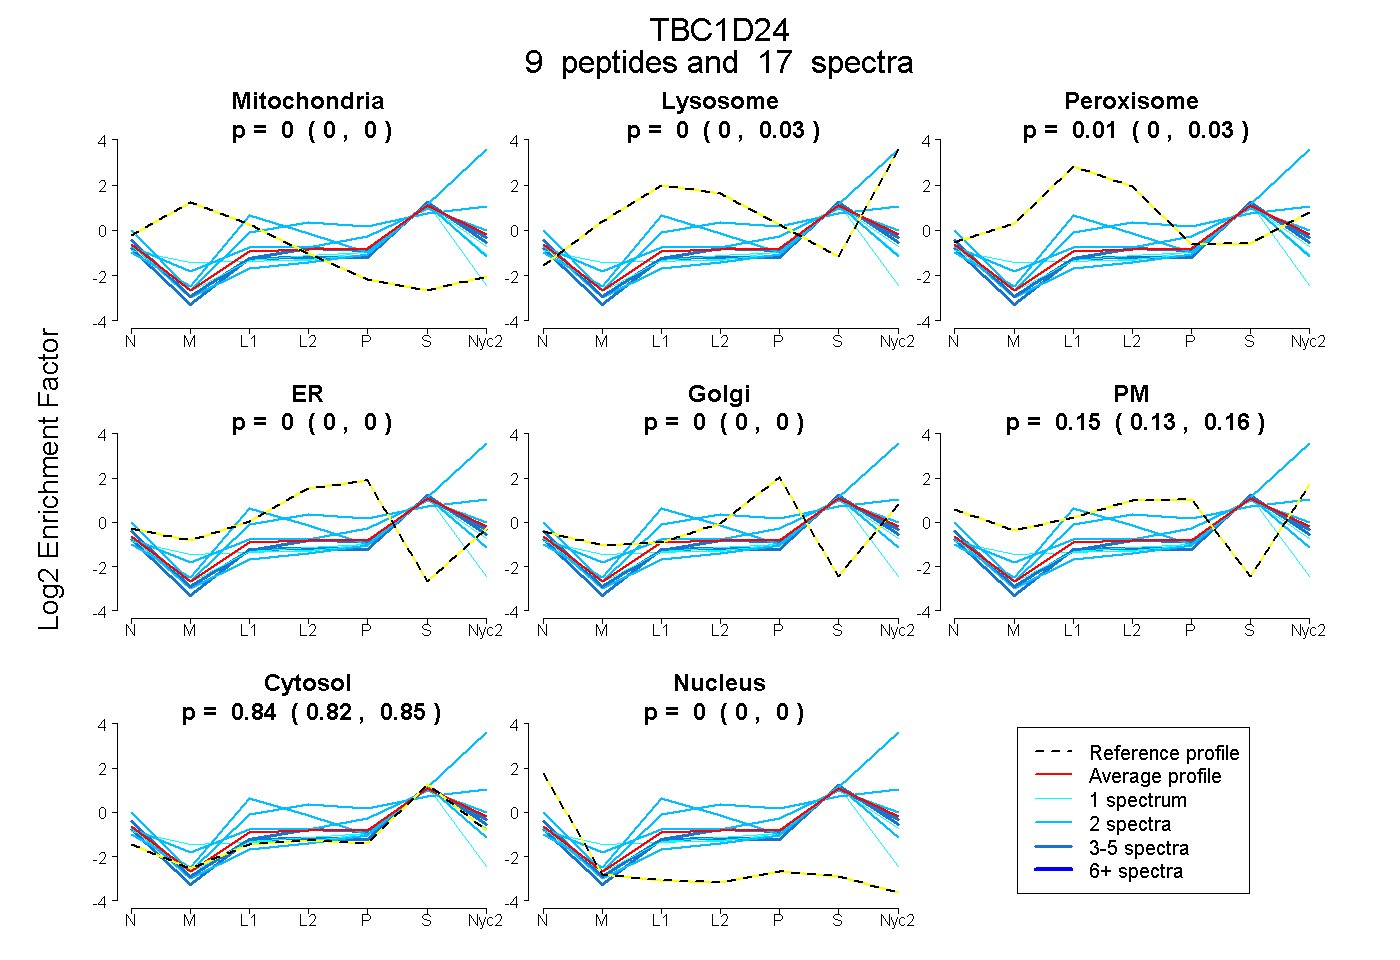
| Plot | Mito | Lyso | Perox | ER | Golgi | PM | Cytosol | Nucleus | |||||
| Expt A |
9 peptides |
17 spectra |
|
0.000 0.000 | 0.000 |
0.000 0.000 | 0.031 |
0.009 0.000 | 0.030 |
0.000 0.000 | 0.000 |
0.000 0.000 | 0.000 |
0.153 0.127 | 0.162 |
0.837 0.820 | 0.853 |
0.000 0.000 | 0.000 |
||
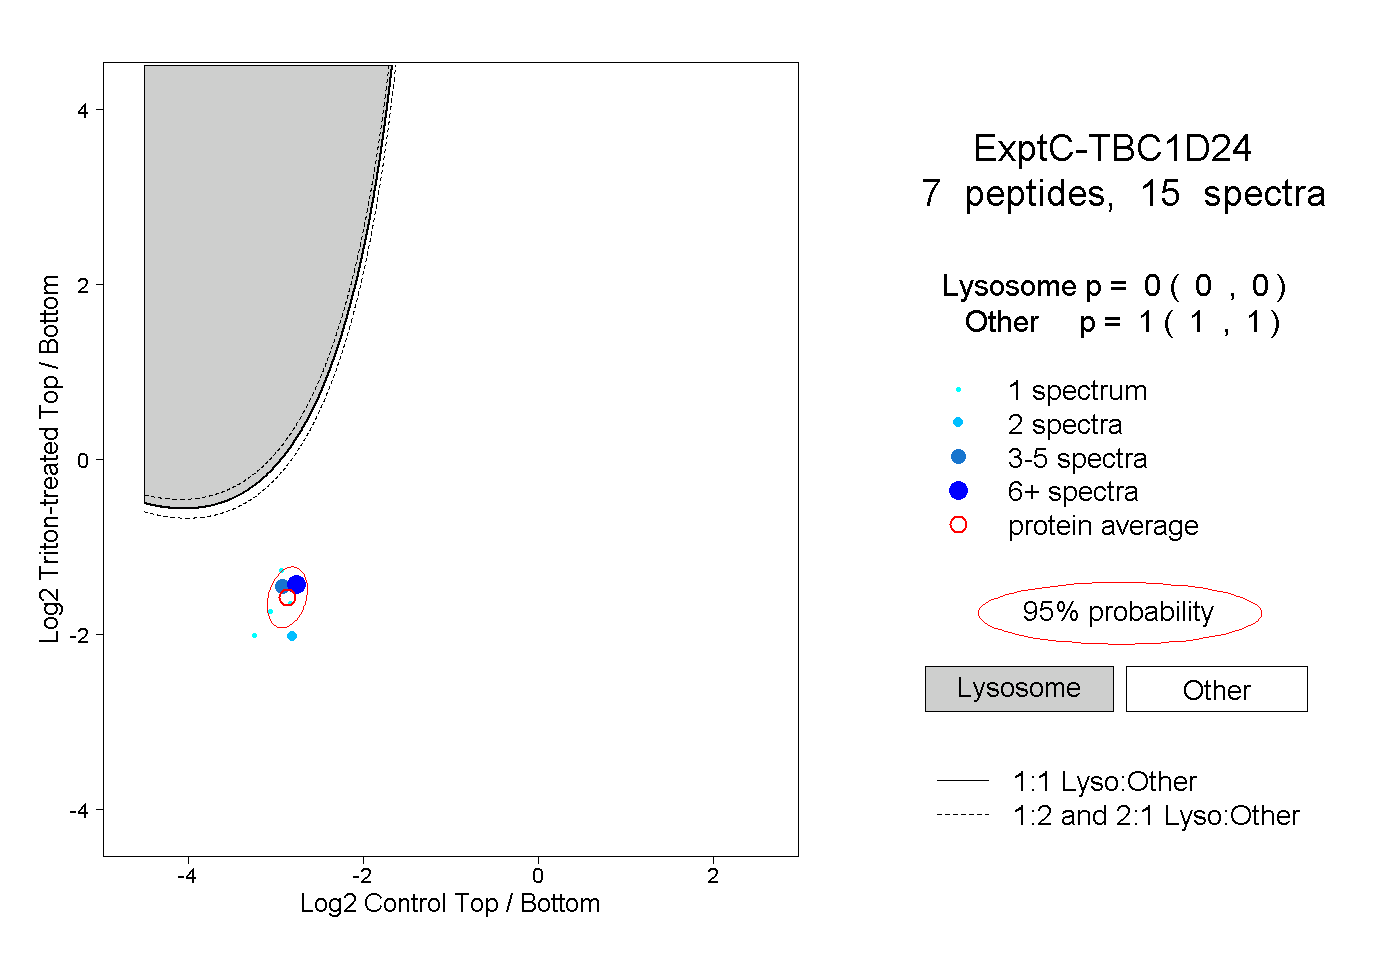
| Plot | Lyso | Other | |||||||||||
| Expt C |
7 peptides |
15 spectra |
|
0.000 0.000 | 0.000 |
1.000 1.000 | 1.000 |