 3
3peptides
spectra
0.000 | 0.074
0.000 | 0.000
0.000 | 0.019
0.000 | 0.228
0.000 | 0.270
0.000 | 0.108
0.617 | 0.667
0.018 | 0.102
1peptide
spectrum
NA | NA
NA | NA
| Plot | Mito | Lyso | Perox | ER | Golgi | PM | Cytosol | Nucleus | |||||
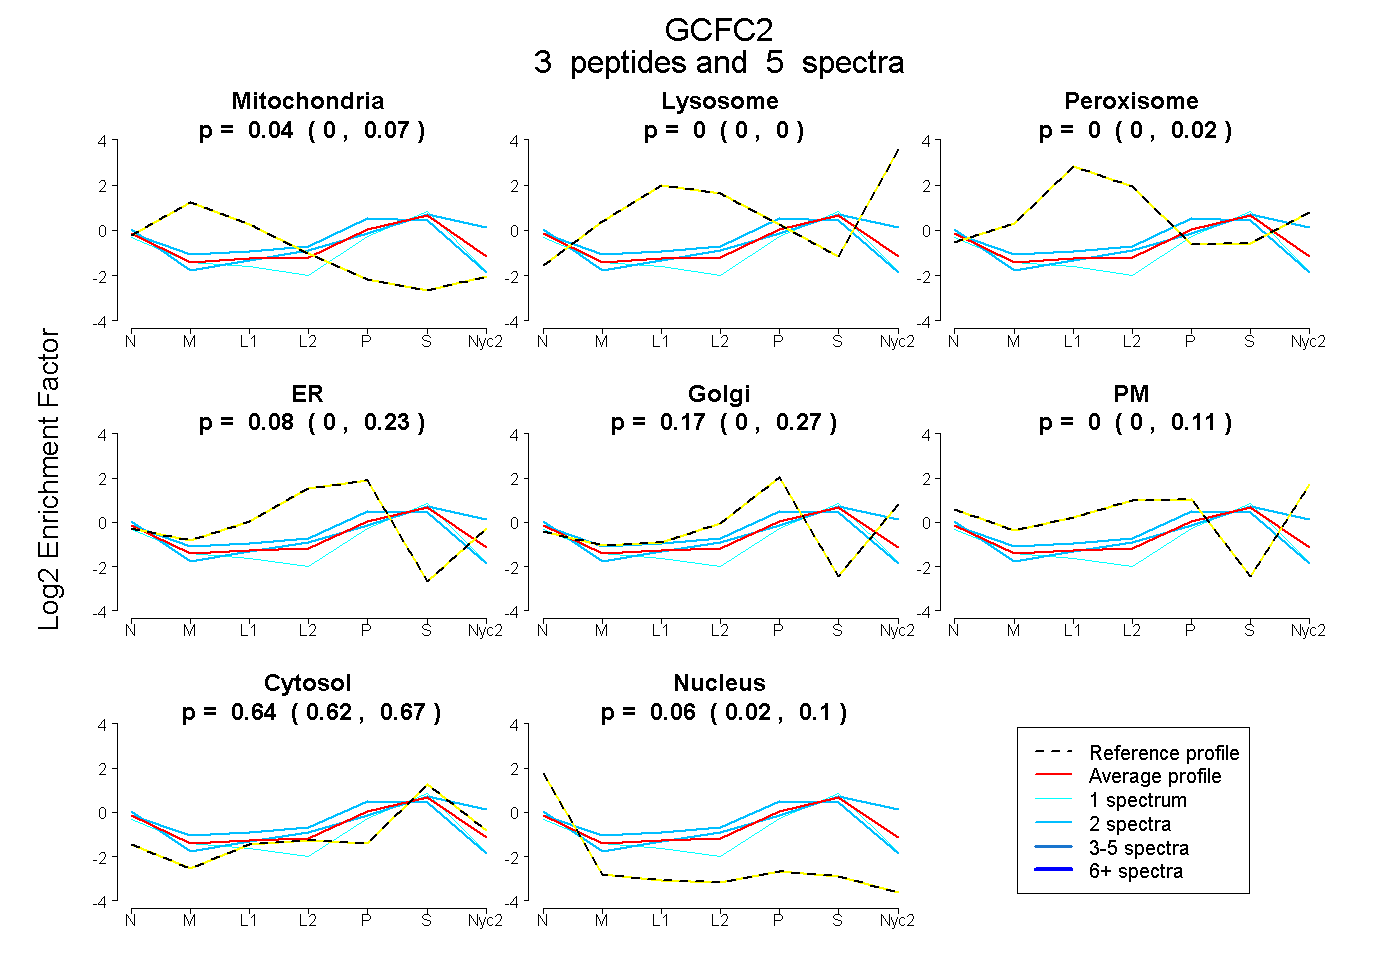
| Expt A |
3 peptides |
5 spectra |
|
0.041 0.000 | 0.074 |
0.000 0.000 | 0.000 |
0.000 0.000 | 0.019 |
0.084 0.000 | 0.228 |
0.175 0.000 | 0.270 |
0.000 0.000 | 0.108 |
0.644 0.617 | 0.667 |
0.057 0.018 | 0.102 |
||
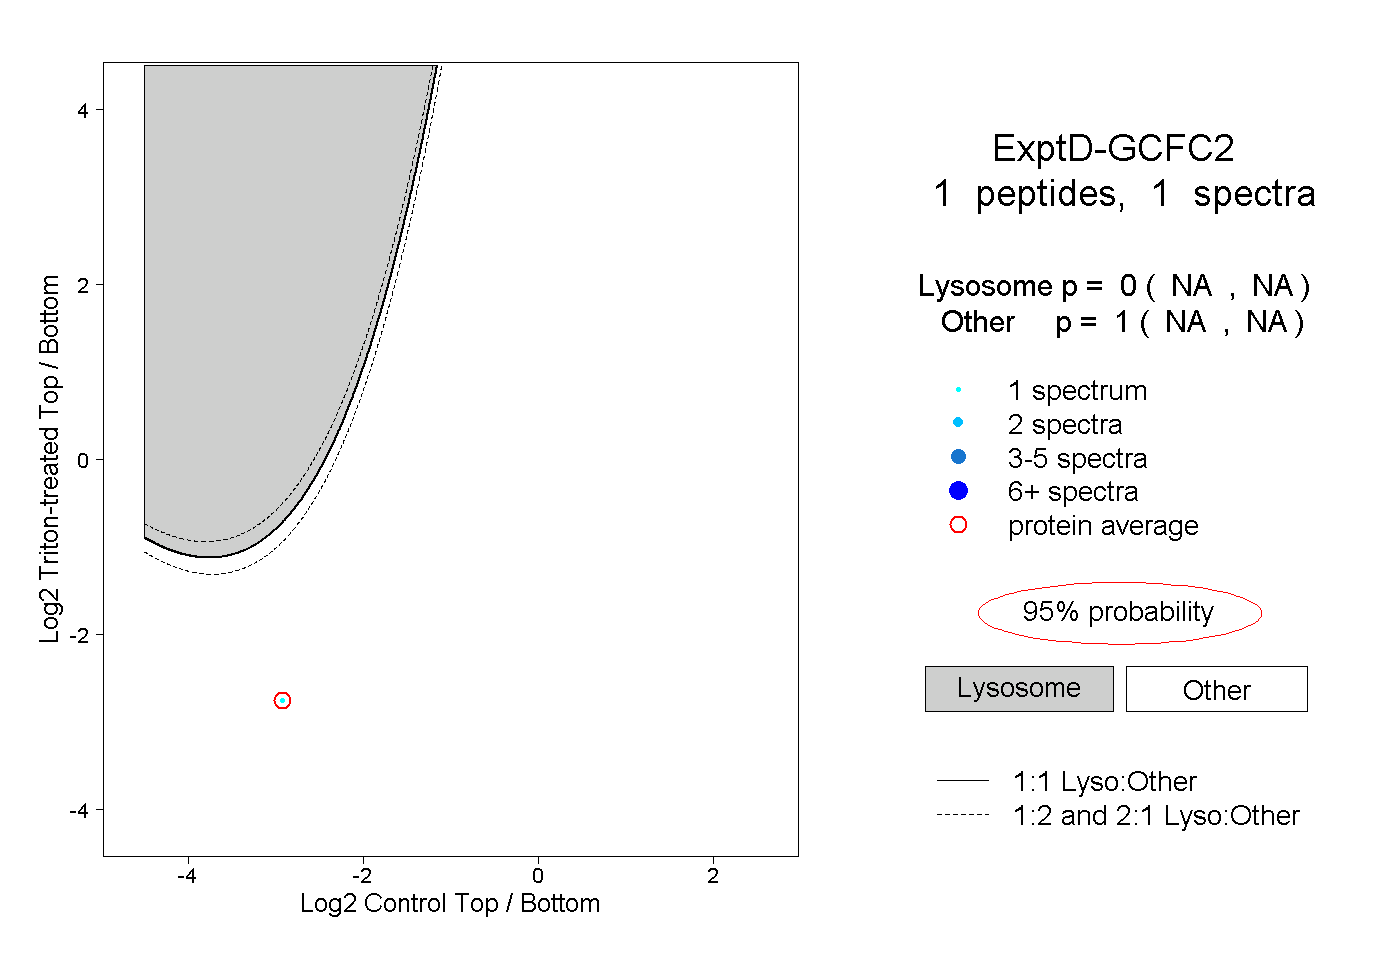
| Plot | Lyso | Other | |||||||||||
| Expt D |
1 peptide |
1 spectrum |
|
0.000 NA | NA |
1.000 NA | NA |