 33
33peptides
spectra
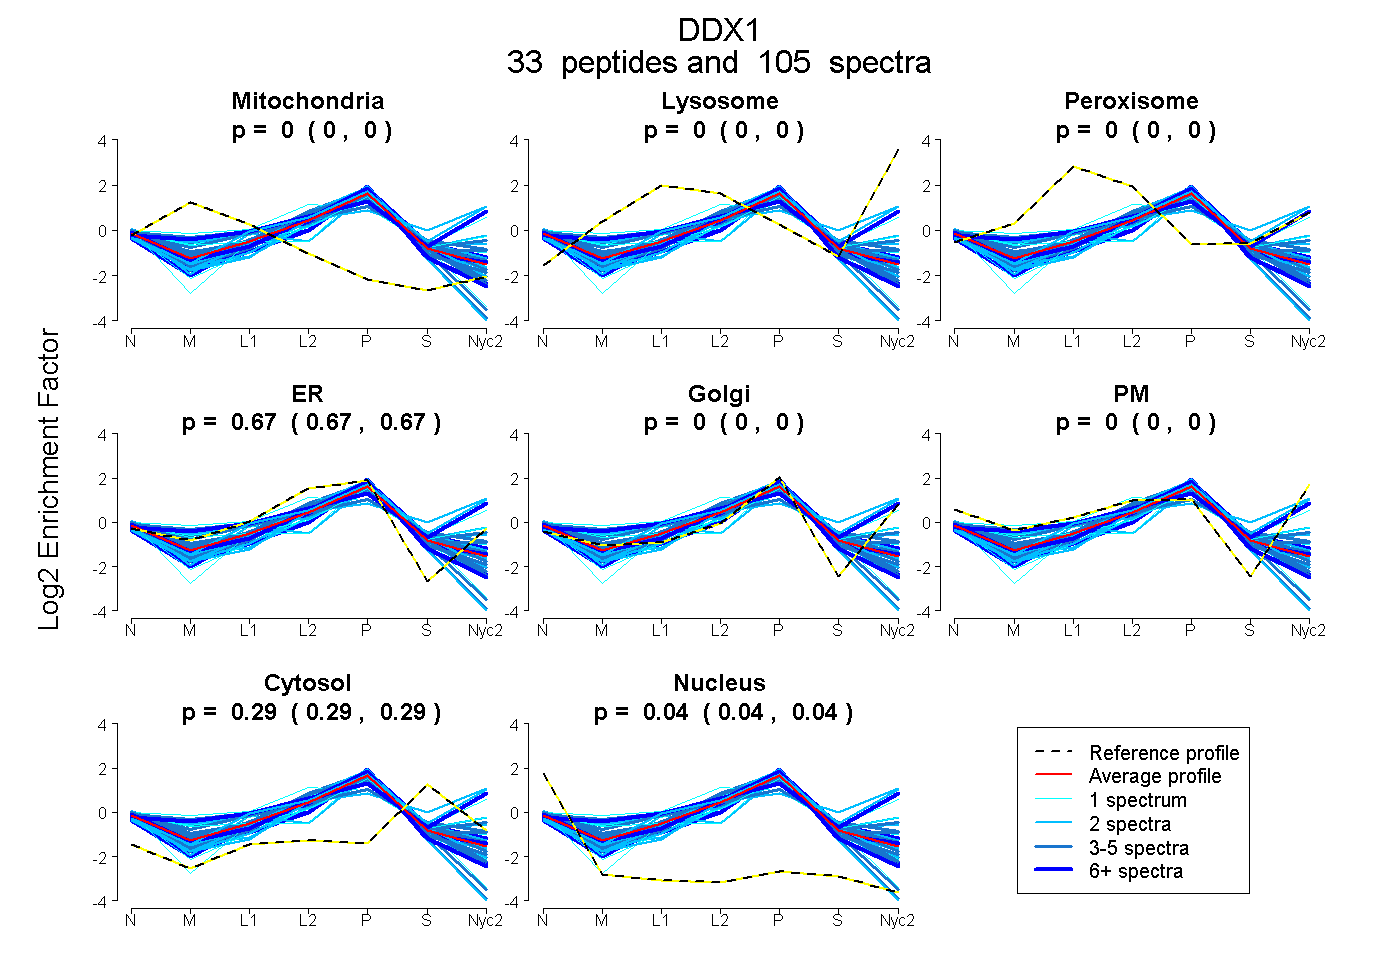
0.000 | 0.000
0.000 | 0.000
0.000 | 0.000
0.666 | 0.670
0.000 | 0.000
0.000 | 0.000
0.287 | 0.292
0.039 | 0.045
17peptides
spectra
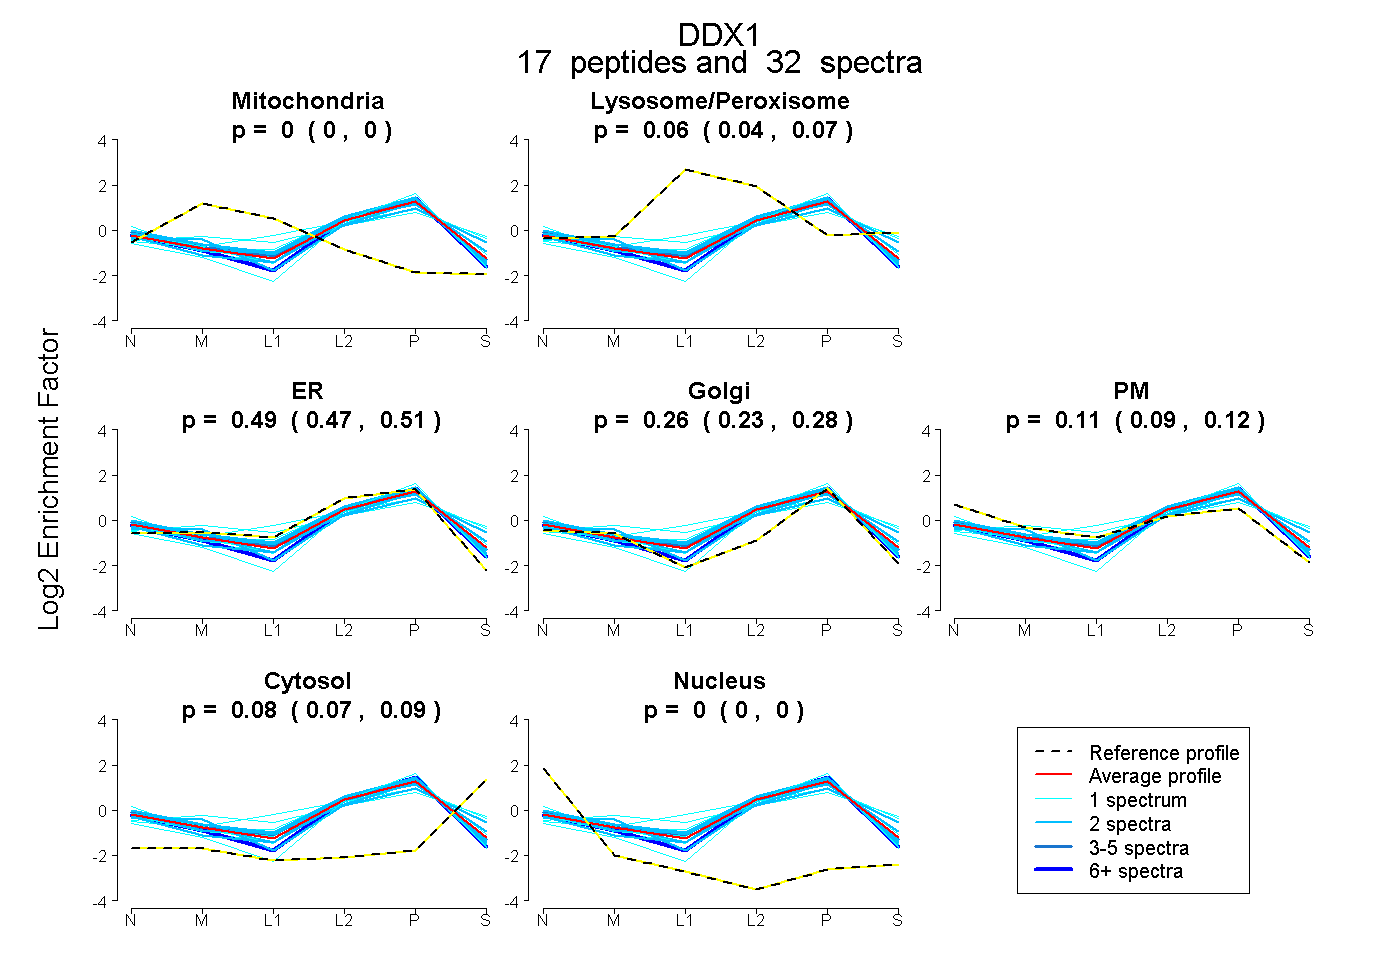
0.000 | 0.000
0.043 | 0.070
0.470 | 0.513
0.234 | 0.280
0.092 | 0.120
0.074 | 0.089
0.000 | 0.000
26peptides
spectra
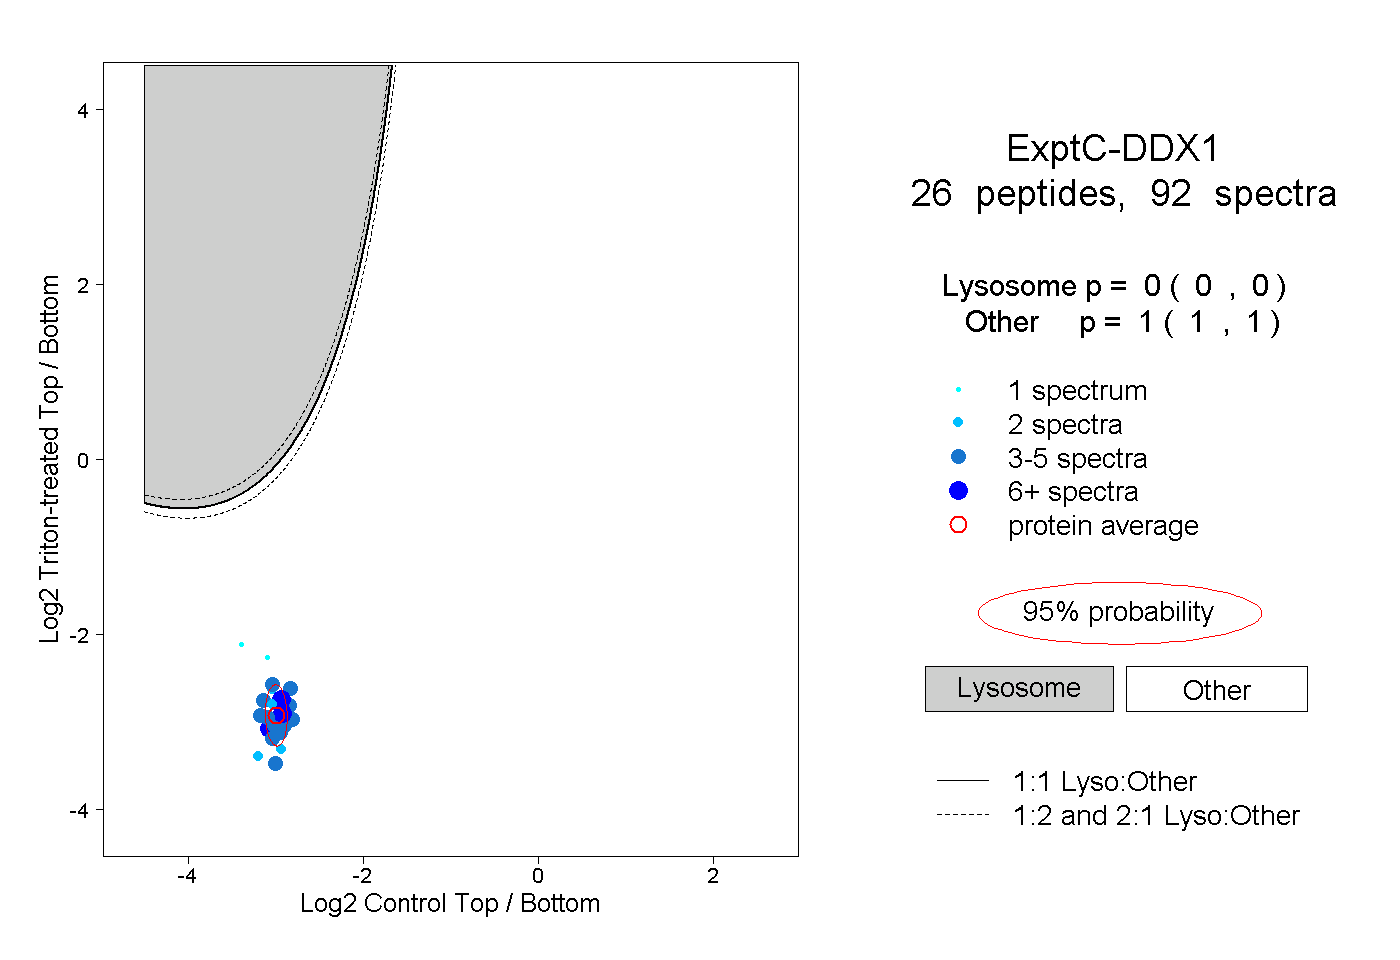
0.000 | 0.000
1.000 | 1.000
11peptides
spectra
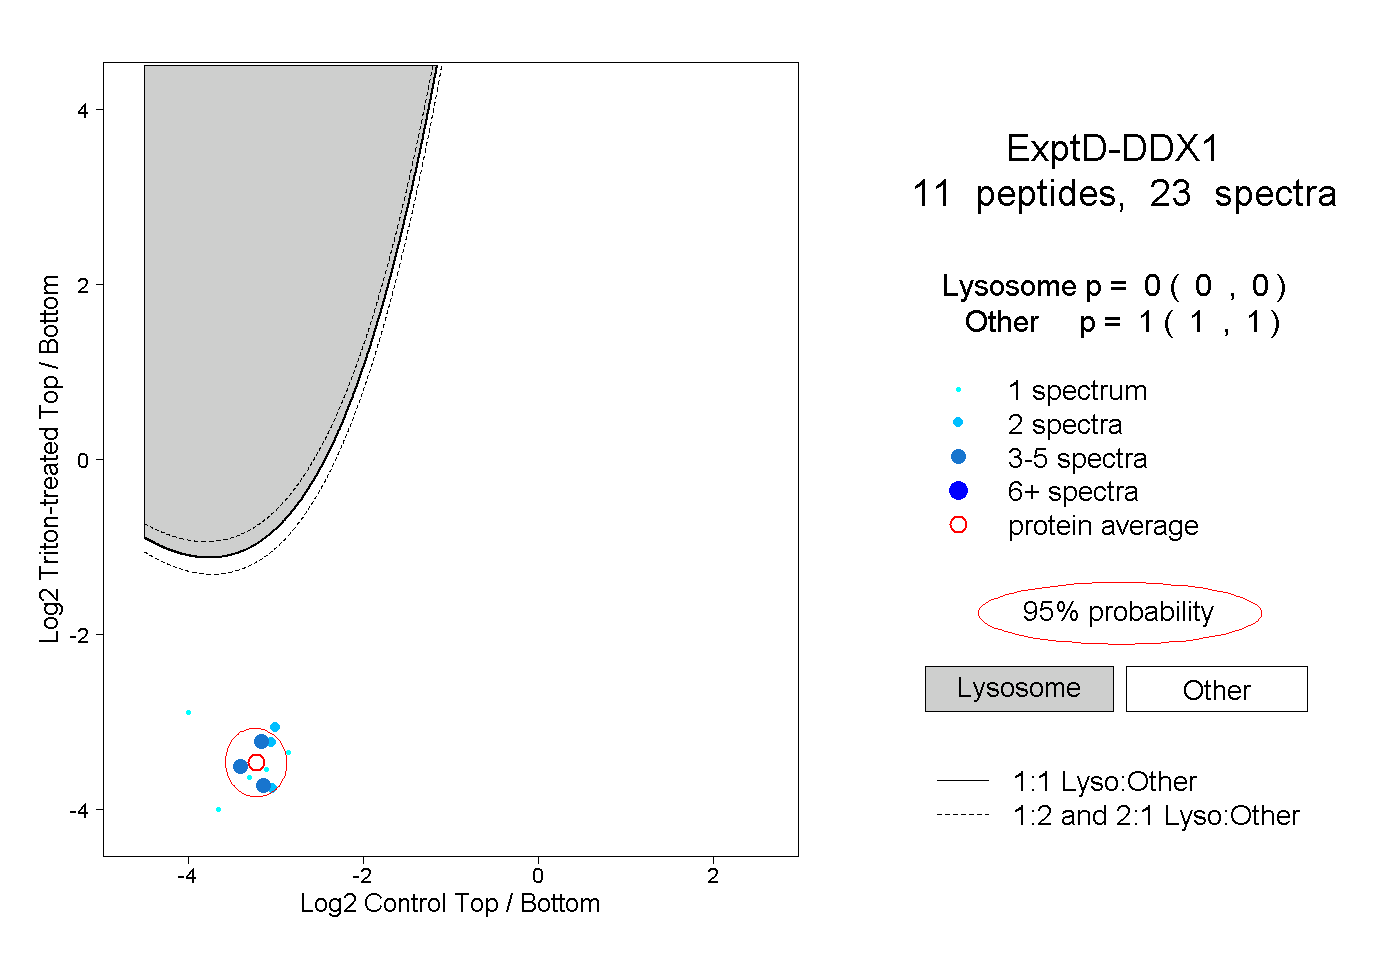
0.000 | 0.000
1.000 | 1.000