RPL34
[ENSRNOP00000009046]
Main page
| | | Plot |
Mito |
Lyso |
|
Perox |
ER |
Golgi |
PM |
Cytosol |
Nucleus |
|
| Expt A |
 6
6
peptides |
71
spectra |
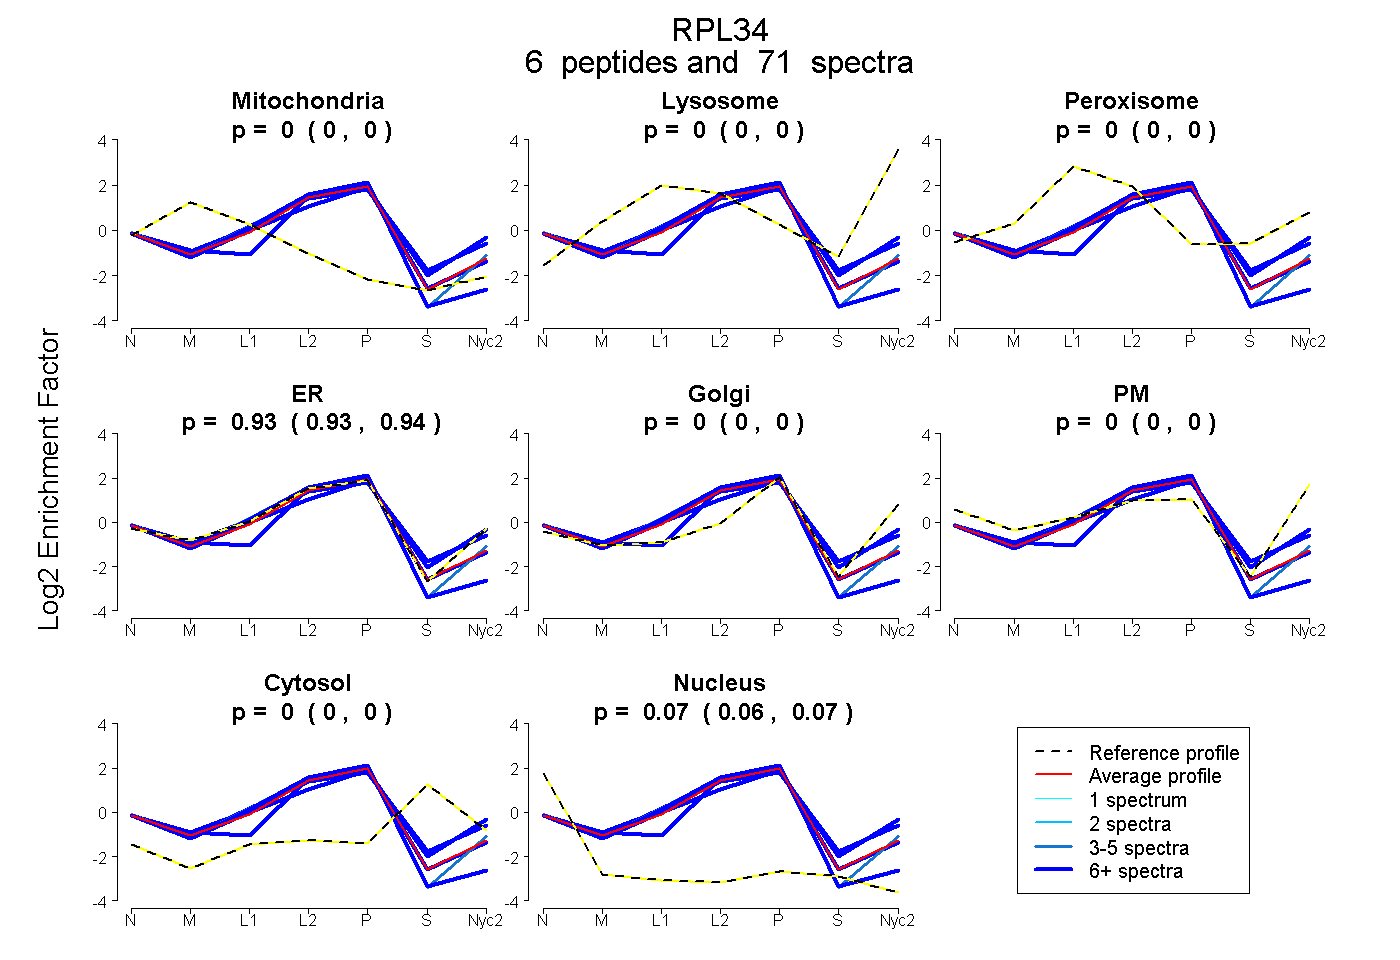 |
0.000
0.000 | 0.000 |
0.000
0.000 | 0.000 |
|
0.000
0.000 | 0.000 |
0.933
0.928 | 0.937 |
0.000
0.000 | 0.000 |
0.000
0.000 | 0.000 |
0.000
0.000 | 0.000 |
0.067
0.063 | 0.071 |
|
| | | Plot |
Mito |
|
Lyso or Perox |
|
ER |
Golgi |
PM |
Cytosol |
Nucleus |
|
| Expt B |
3
peptides |
14
spectra |
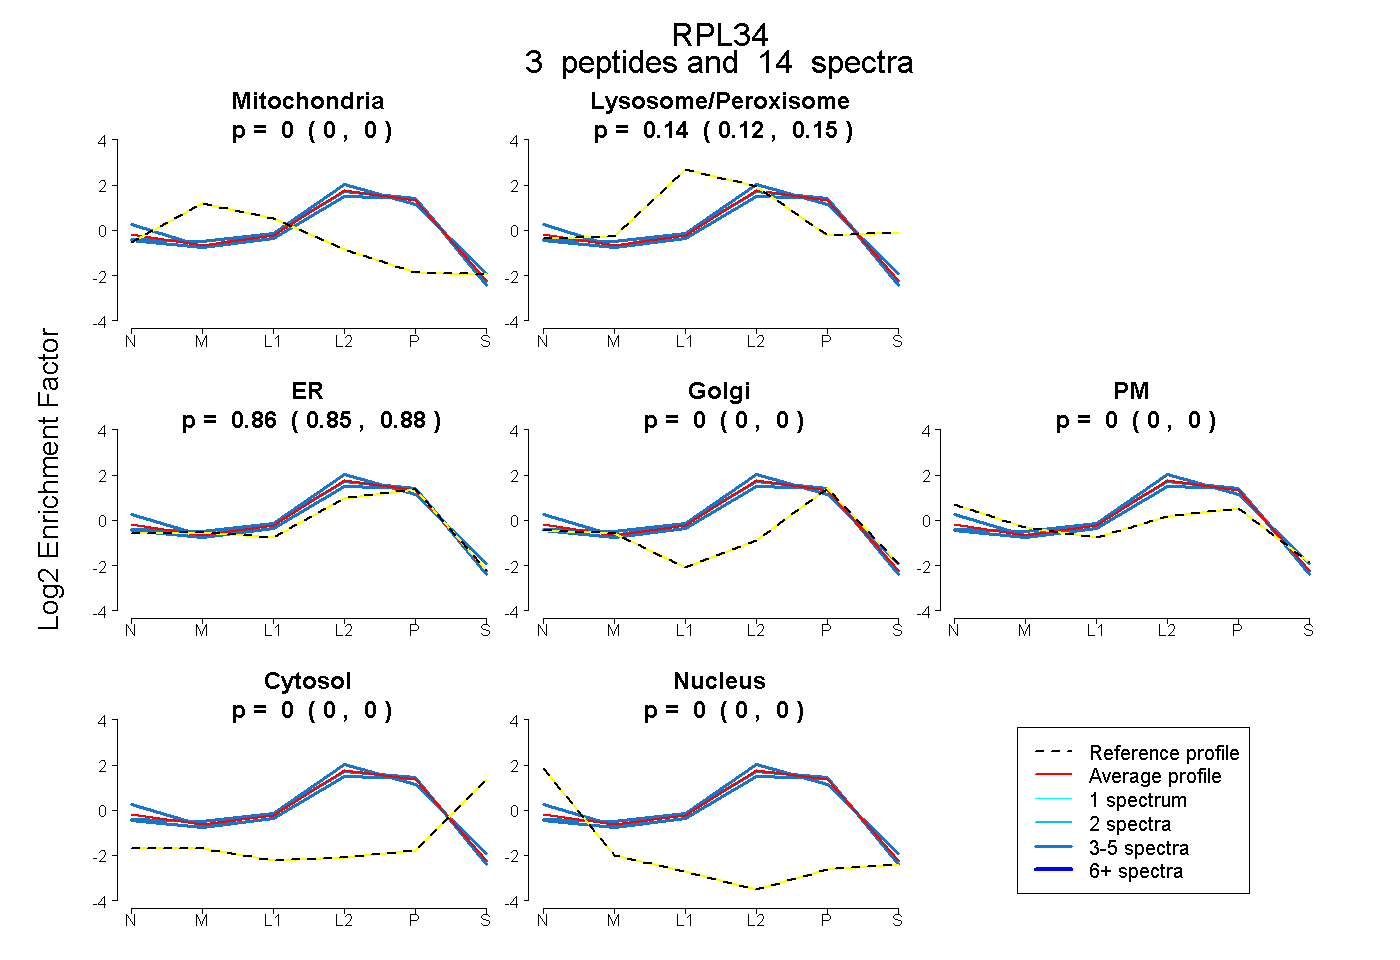 |
0.000
0.000 | 0.000 |
|
0.136
0.119 | 0.149 |
|
0.864
0.847 | 0.879 |
0.000
0.000 | 0.000 |
0.000
0.000 | 0.000 |
0.000
0.000 | 0.000 |
0.000
0.000 | 0.000 |
|
| | | Plot |
|
Lyso |
|
|
|
|
|
|
|
Other |
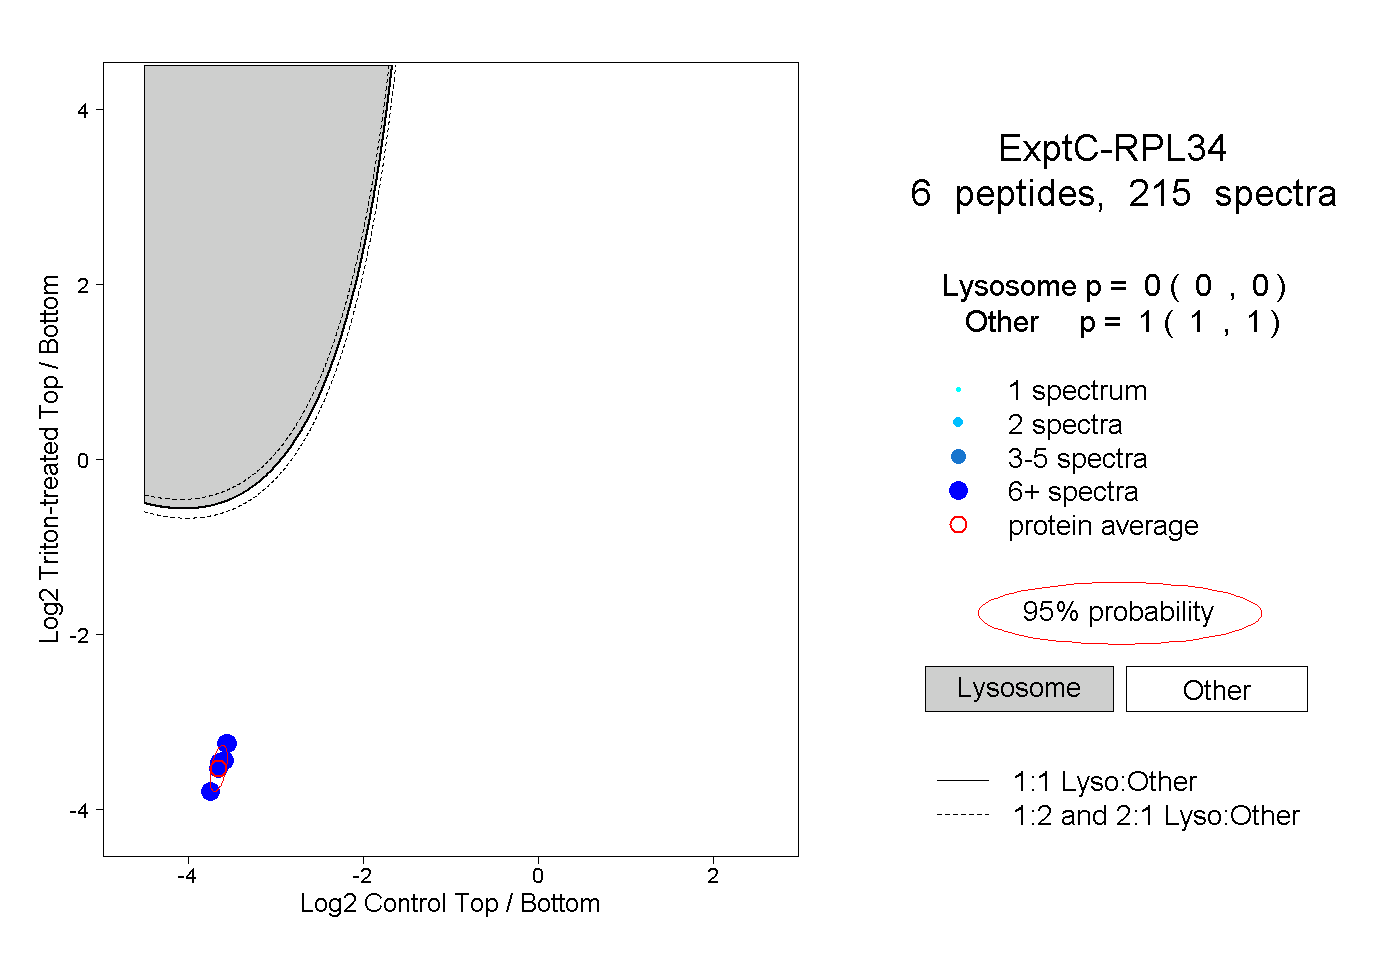
| Expt C |
6
peptides |
215
spectra |
 |
|
0.000
0.000 | 0.000 |
|
|
|
|
|
|
|
1.000
1.000 | 1.000 |
| 70 spectra, AQAQSQK |
|
0.000 |
|
|
|
|
|
|
|
1.000 |
| 29 spectra, AYGGSMCAK |
|
0.000 |
|
|
|
|
|
|
|
1.000 |
| 27 spectra, SACGVCPGR |
|
0.000 |
|
|
|
|
|
|
|
1.000 |
| 41 spectra, IVYLYTK |
|
0.000 |
|
|
|
|
|
|
|
1.000 |
| 29 spectra, LSYNTASNK |
|
0.000 |
|
|
|
|
|
|
|
1.000 |
| 19 spectra, AFLIEEQK |
|
0.000 |
|
|
|
|
|
|
|
1.000 |
| | | Plot |
|
Lyso |
|
|
|
|
|
|
|
Other |
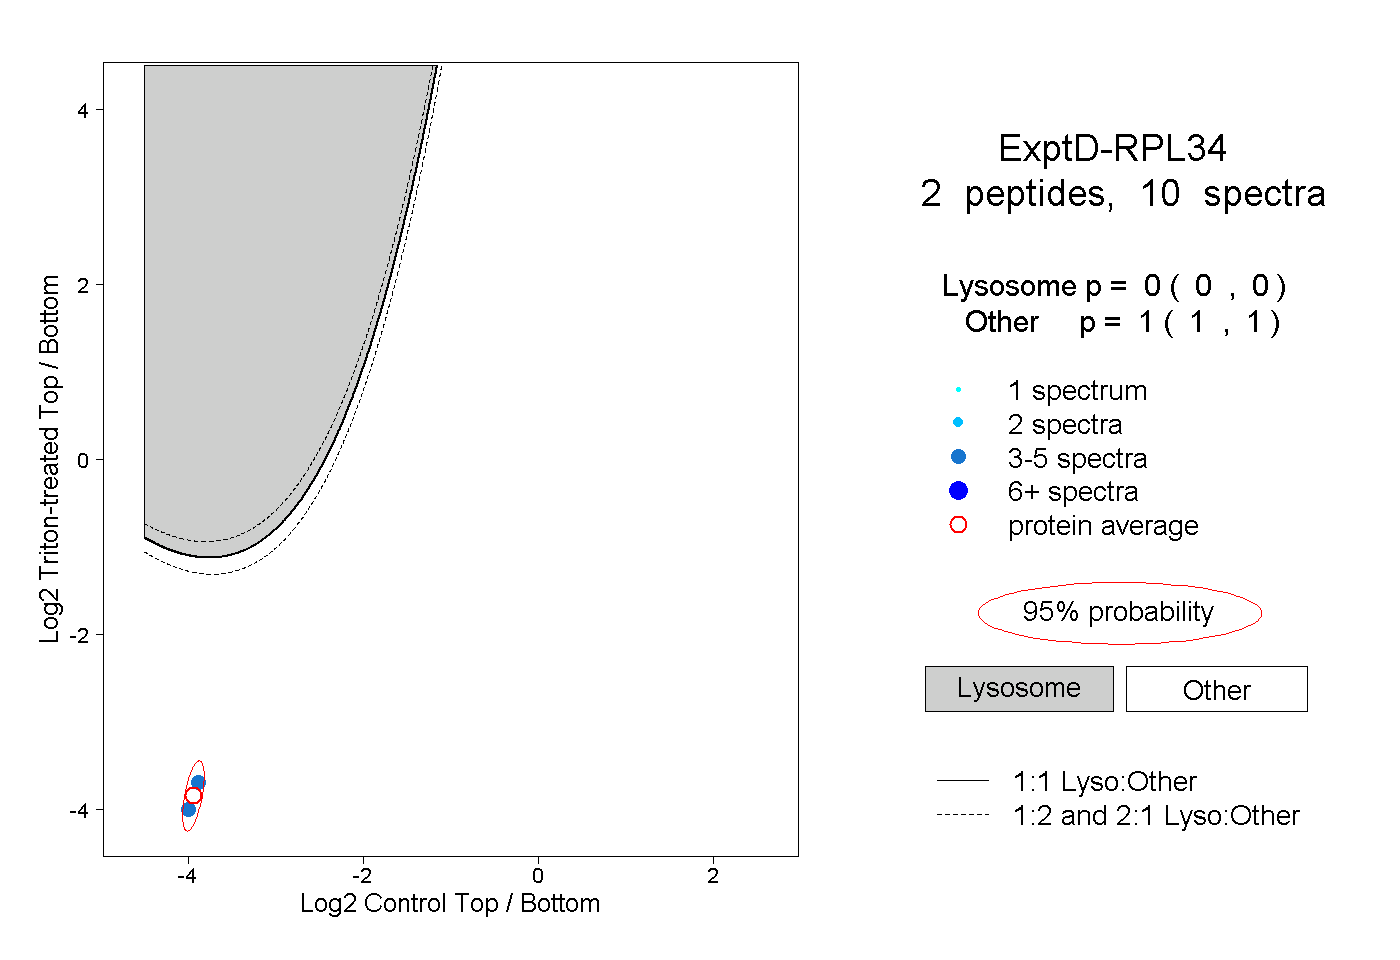
| Expt D |
2
peptides |
10
spectra |
 |
|
0.000
0.000 | 0.000 |
|
|
|
|
|
|
|
1.000
1.000 | 1.000 |