 5
5peptides
spectra
0.000 | 0.000
0.000 | 0.000
0.000 | 0.000
0.000 | 0.000
0.000 | 0.000
0.000 | 0.000
0.974 | 0.992
0.007 | 0.024
| Plot | Mito | Lyso | Perox | ER | Golgi | PM | Cytosol | Nucleus | |||||
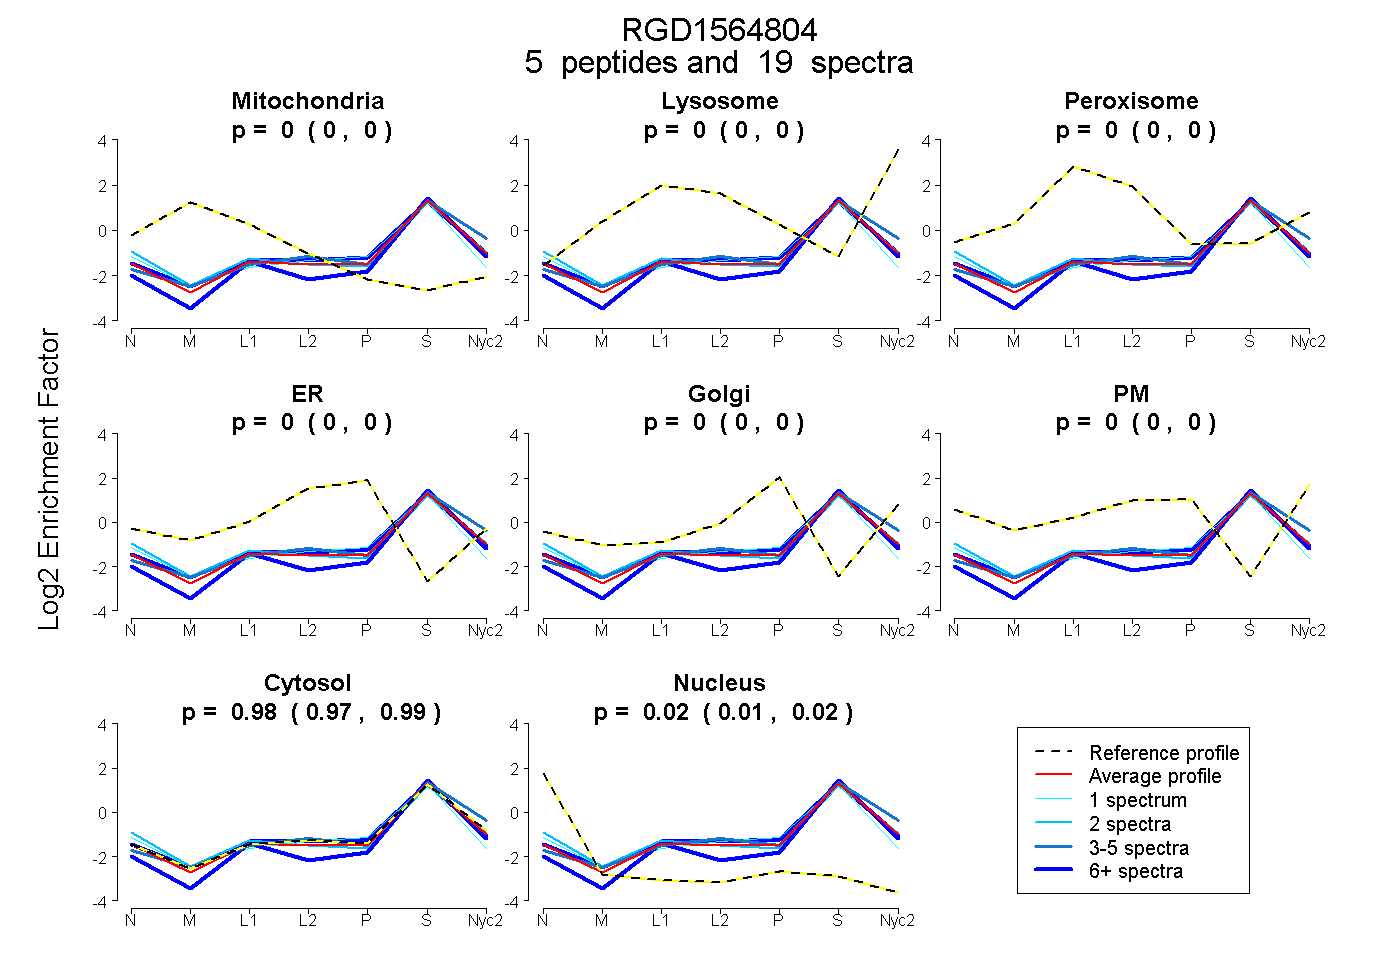
| Expt A |
5 peptides |
19 spectra |
|
0.000 0.000 | 0.000 |
0.000 0.000 | 0.000 |
0.000 0.000 | 0.000 |
0.000 0.000 | 0.000 |
0.000 0.000 | 0.000 |
0.000 0.000 | 0.000 |
0.984 0.974 | 0.992 |
0.016 0.007 | 0.024 |
| 7 spectra, KPGNIYYLYQR | 0.000 | 0.000 | 0.000 | 0.000 | 0.000 | 0.000 | 0.982 | 0.018 | ||
| 1 spectrum, DADLHHVACNMVK | 0.000 | 0.000 | 0.000 | 0.000 | 0.000 | 0.000 | 0.925 | 0.075 | ||
| 3 spectra, LTVIAEQIQHLQDQAR | 0.000 | 0.037 | 0.000 | 0.000 | 0.000 | 0.000 | 0.963 | 0.000 | ||
| 6 spectra, ADEFIR | 0.006 | 0.000 | 0.000 | 0.005 | 0.000 | 0.000 | 0.988 | 0.000 | ||
| 2 spectra, ANATNK | 0.000 | 0.000 | 0.023 | 0.000 | 0.000 | 0.000 | 0.914 | 0.062 |
| Plot | Mito | Lyso or Perox | ER | Golgi | PM | Cytosol | Nucleus | ||||||
| Expt B |
3 peptides |
6 spectra |
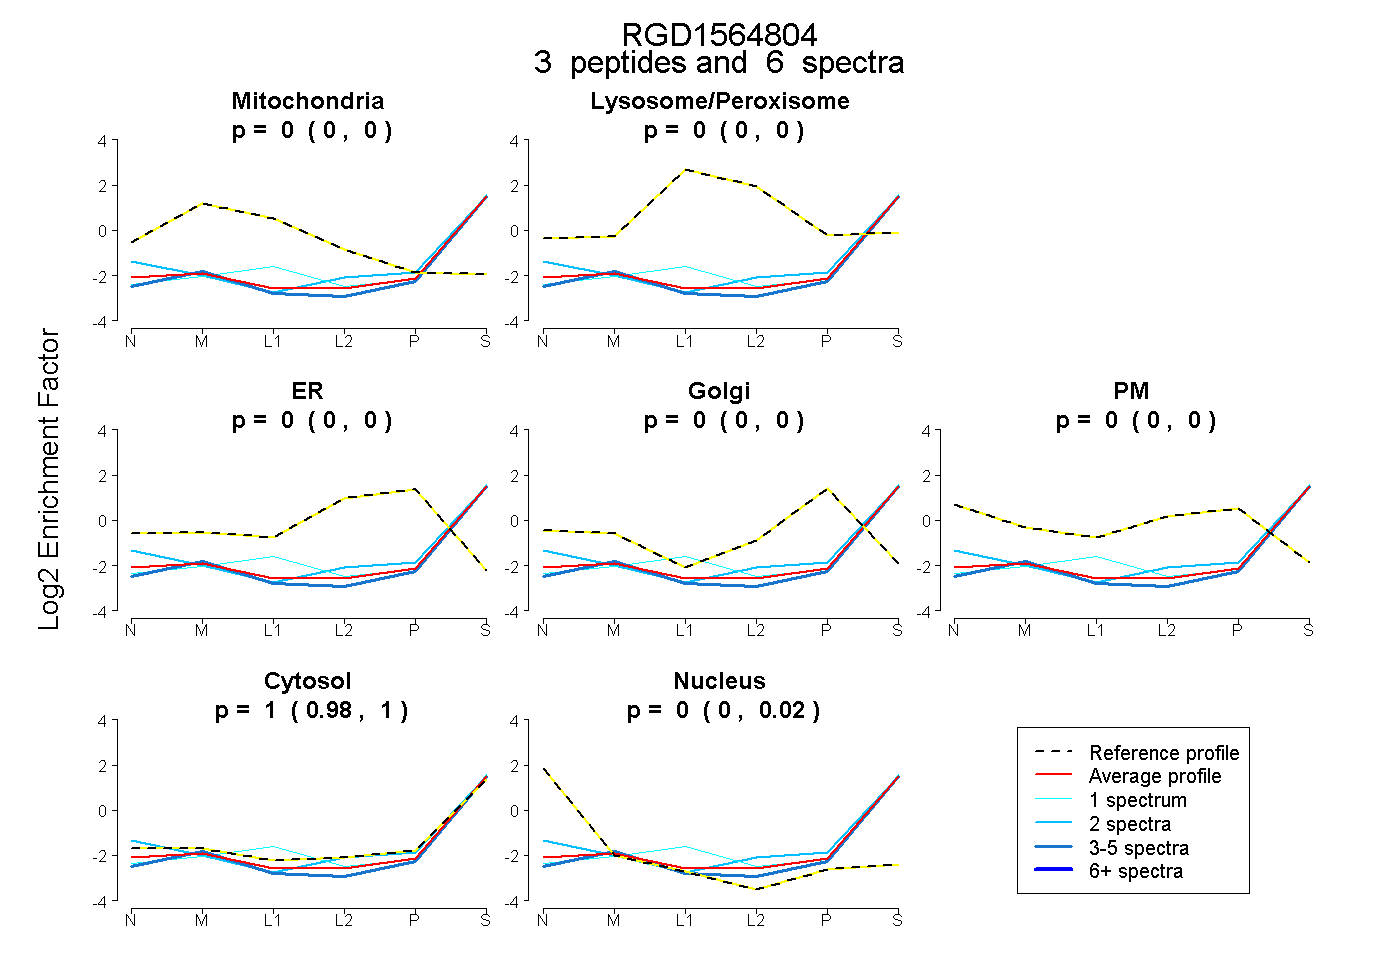 |
0.000 0.000 | 0.000 |
0.000 0.000 | 0.000 |
0.000 0.000 | 0.000 |
0.000 0.000 | 0.000 |
0.000 0.000 | 0.000 |
1.000 0.977 | 1.000 |
0.000 0.000 | 0.016 |
|||
| Plot | Lyso | Other | |||||||||||
| Expt C |
4 peptides |
13 spectra |
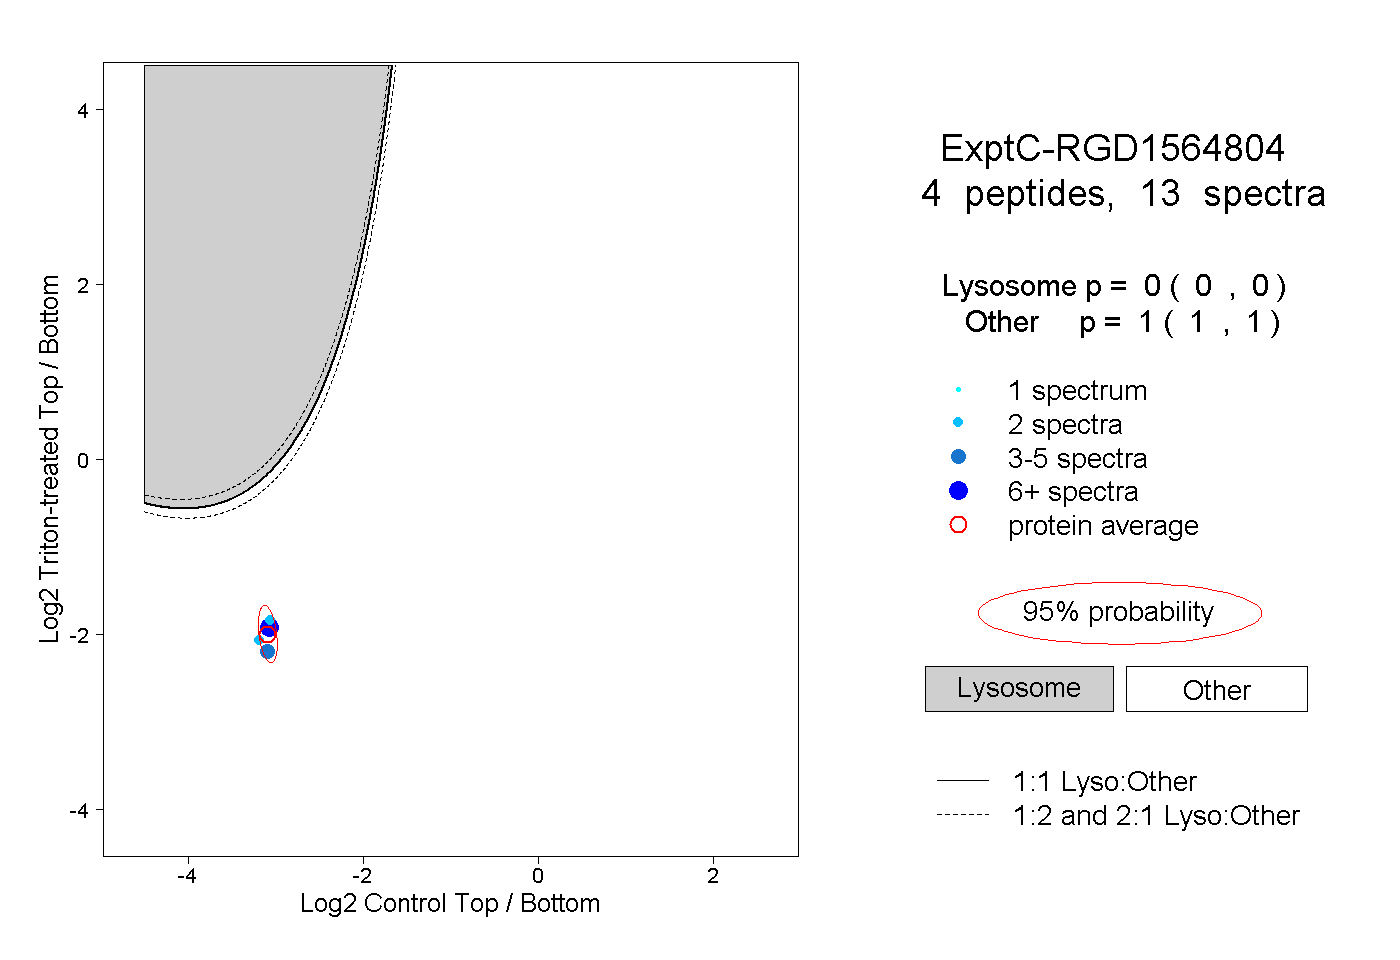 |
0.000 0.000 | 0.000 |
1.000 1.000 | 1.000 |
||||||||
| Plot | Lyso | Other | |||||||||||
| Expt D |
1 peptide |
2 spectra |
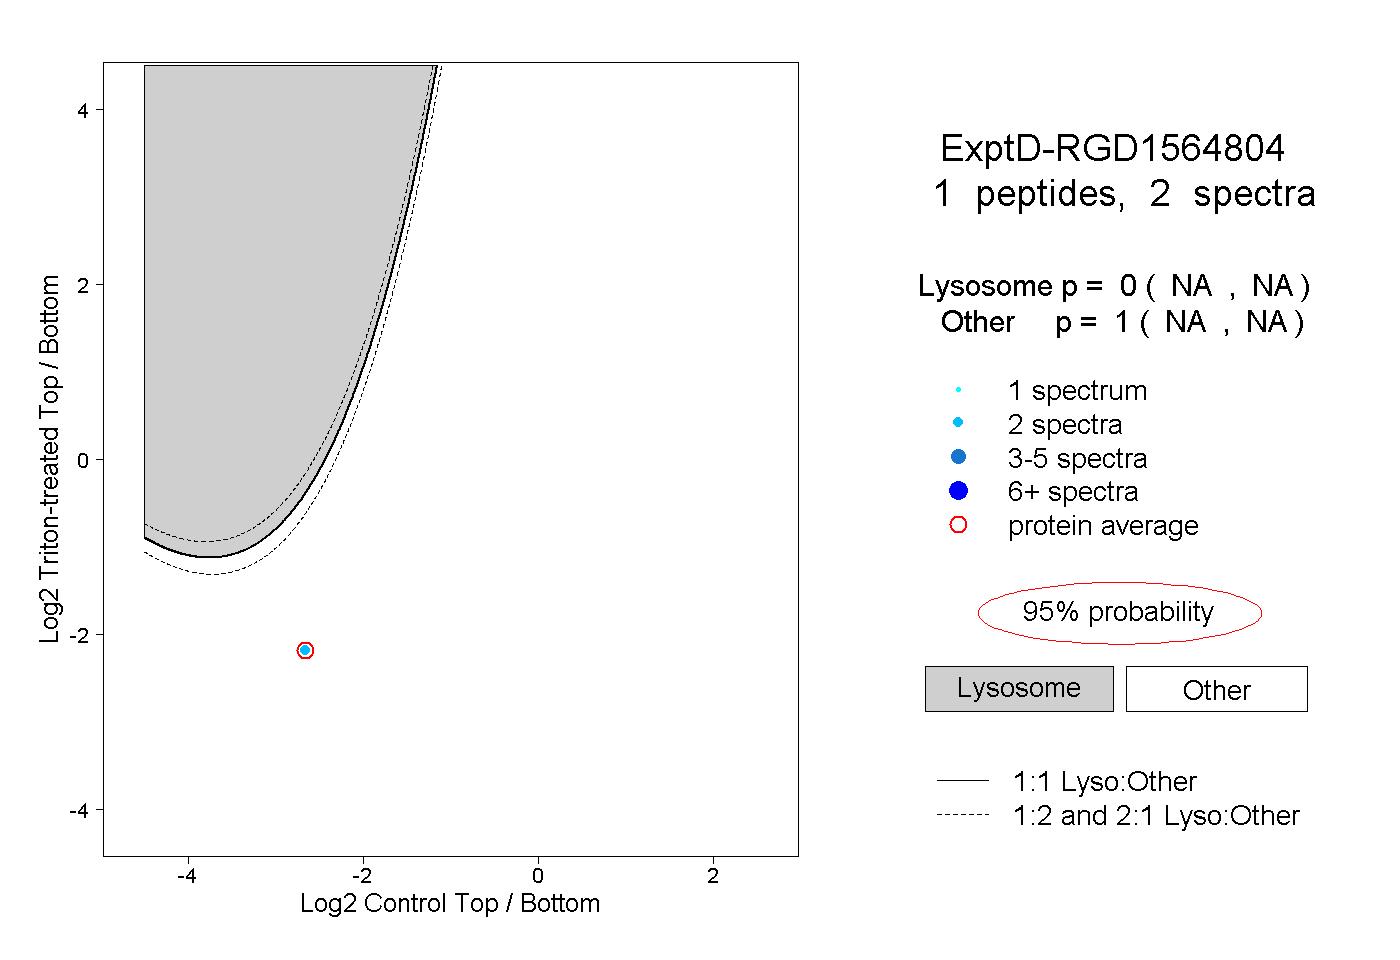 |
0.000 NA | NA |
1.000 NA | NA |