 57
57peptides
spectra
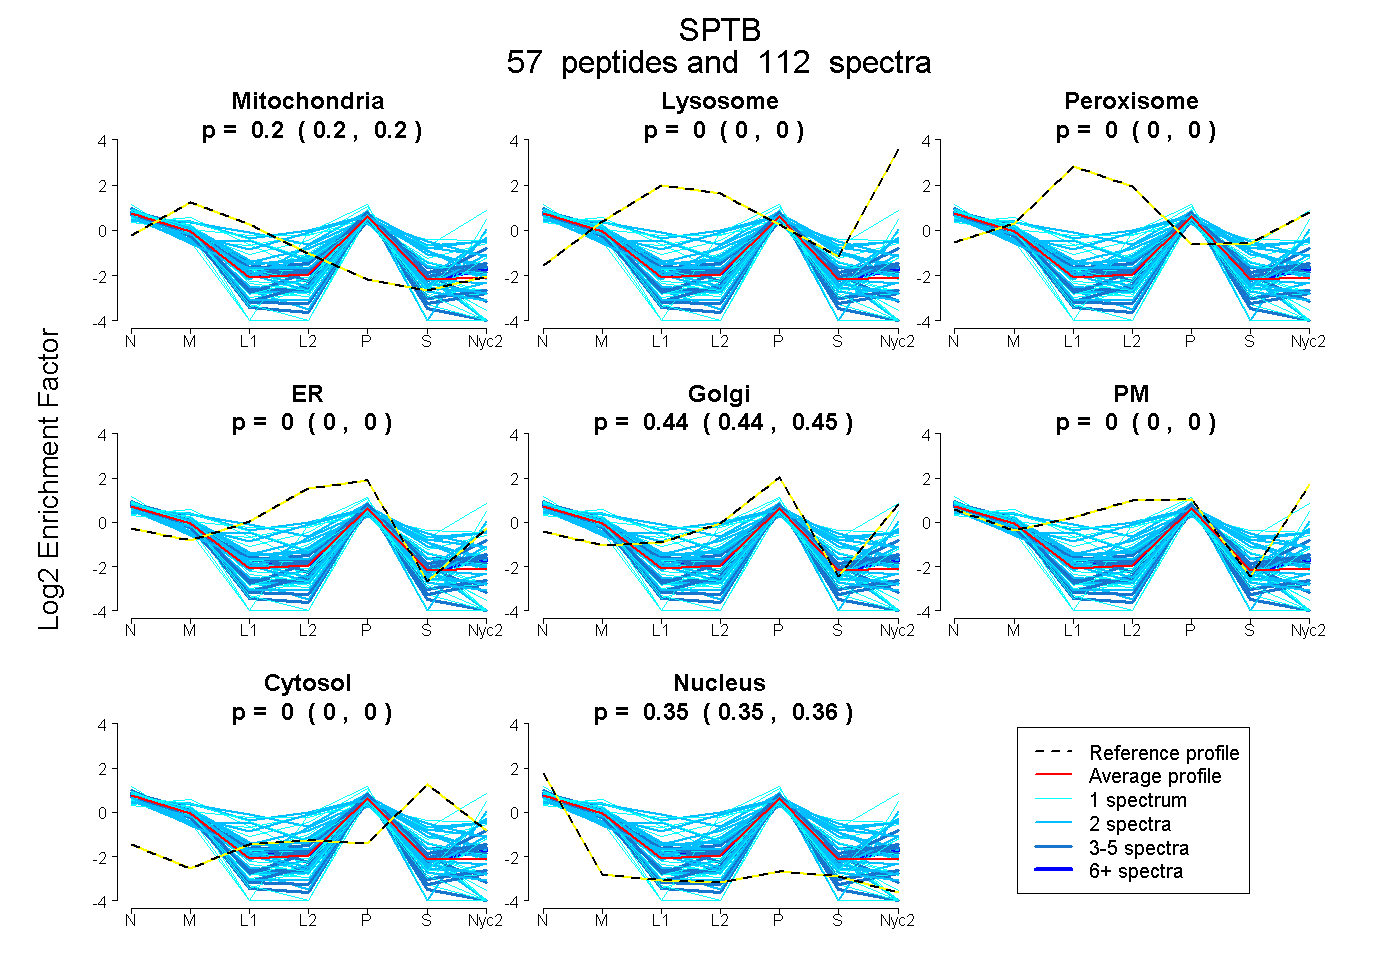
0.198 | 0.204
0.000 | 0.000
0.000 | 0.000
0.000 | 0.000
0.441 | 0.447
0.000 | 0.000
0.000 | 0.000
0.351 | 0.356
20peptides
spectra
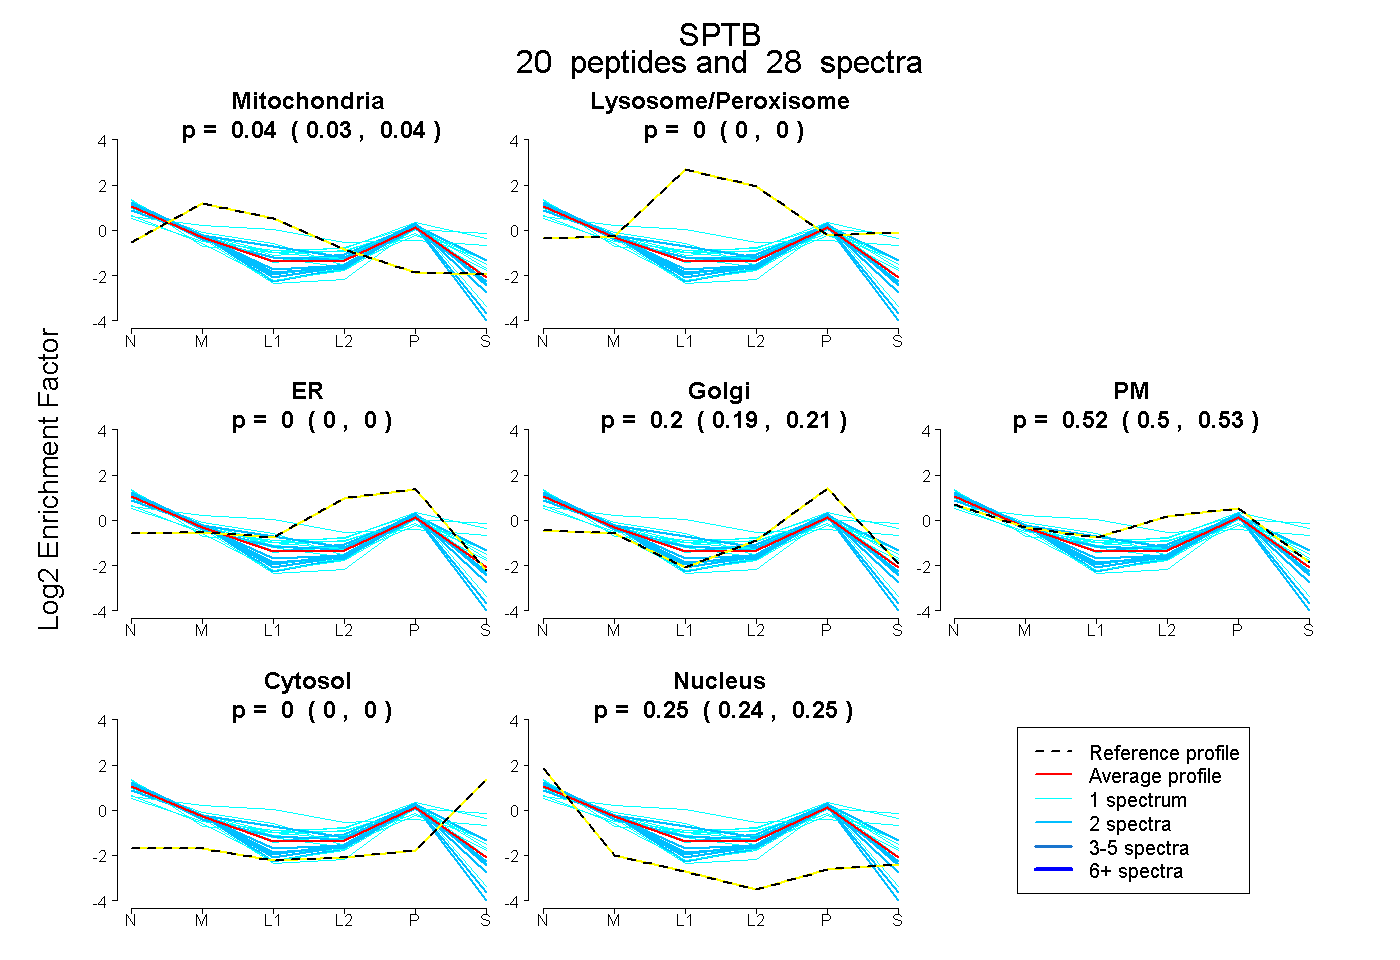
0.030 | 0.045
0.000 | 0.000
0.000 | 0.000
0.187 | 0.213
0.499 | 0.530
0.000 | 0.000
0.240 | 0.250
8peptides
spectra
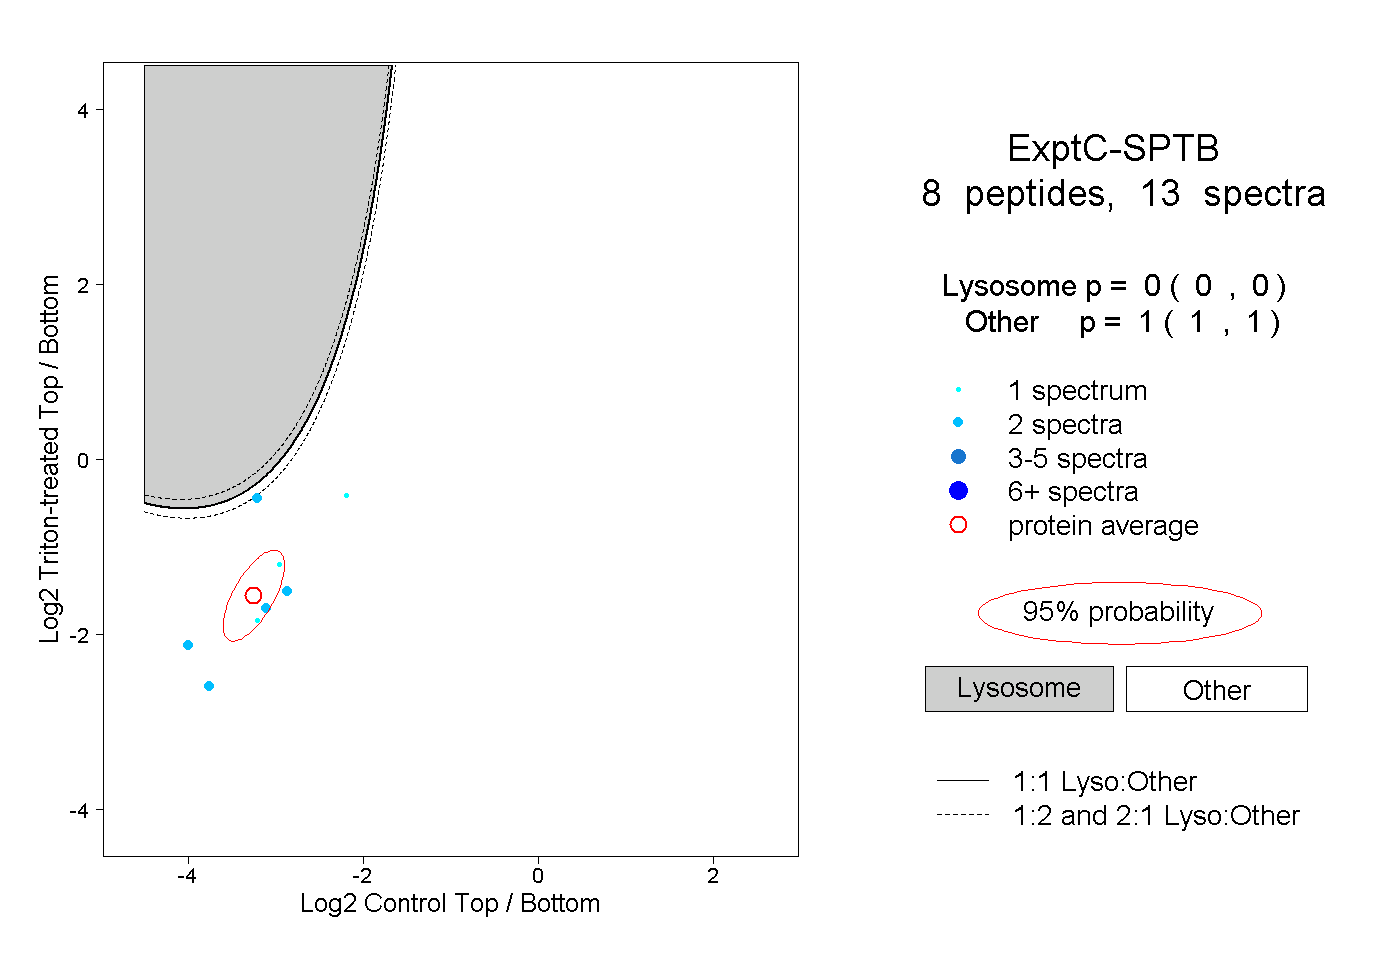
0.000 | 0.000
1.000 | 1.000
4peptides
spectra
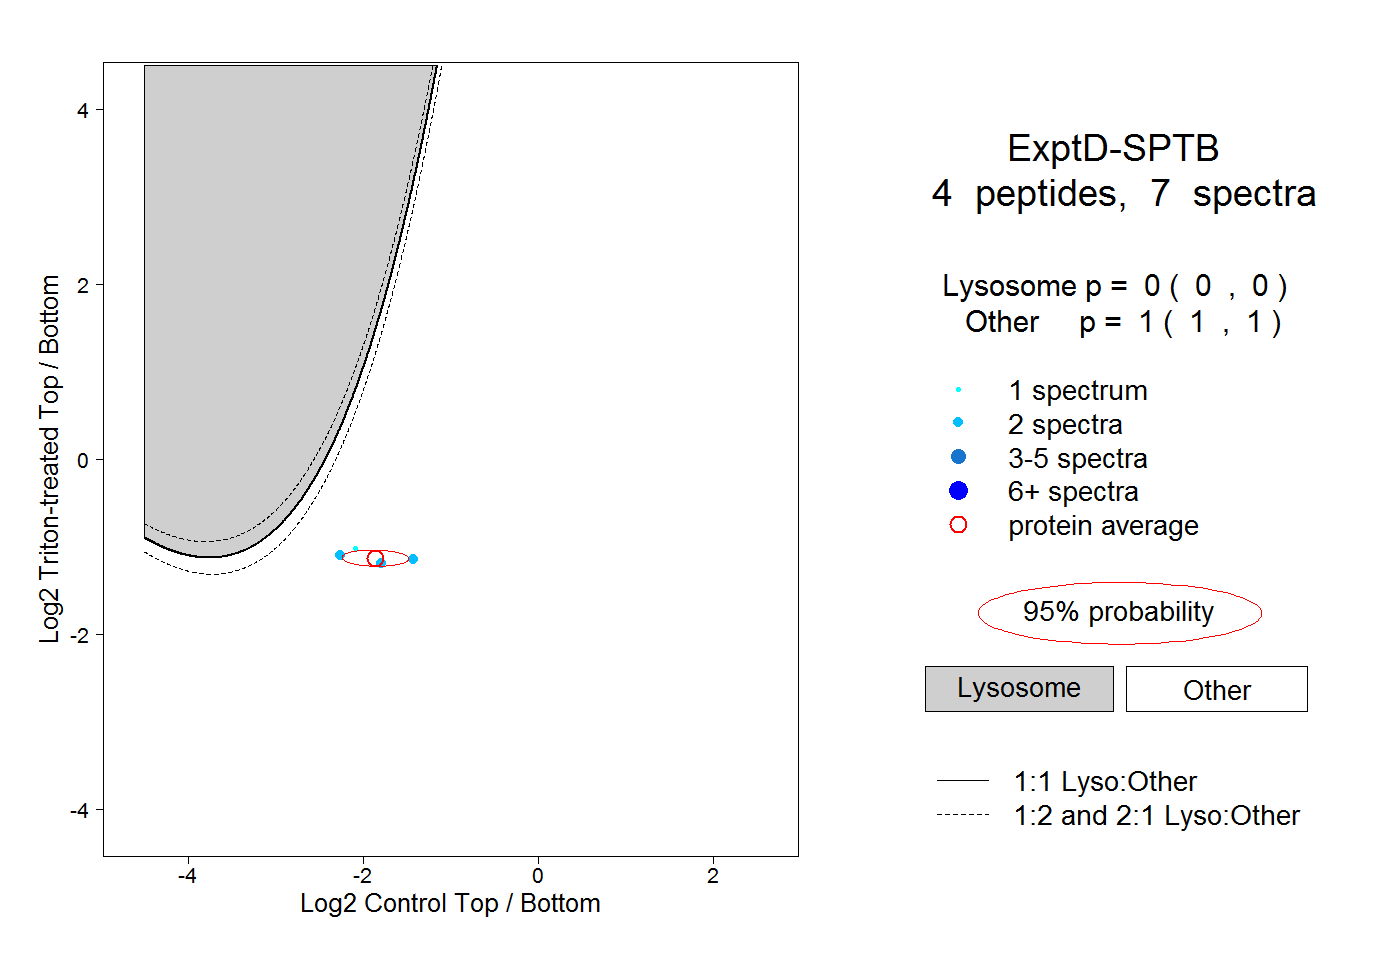
0.000 | 0.000
1.000 | 1.000