 4
4peptides
spectra
0.000 | 0.000
0.000 | 0.169
0.000 | 0.155
0.000 | 0.138
0.000 | 0.302
0.034 | 0.400
0.382 | 0.545
0.000 | 0.000
2peptides
spectra
0.000 | 0.000
1.000 | 1.000
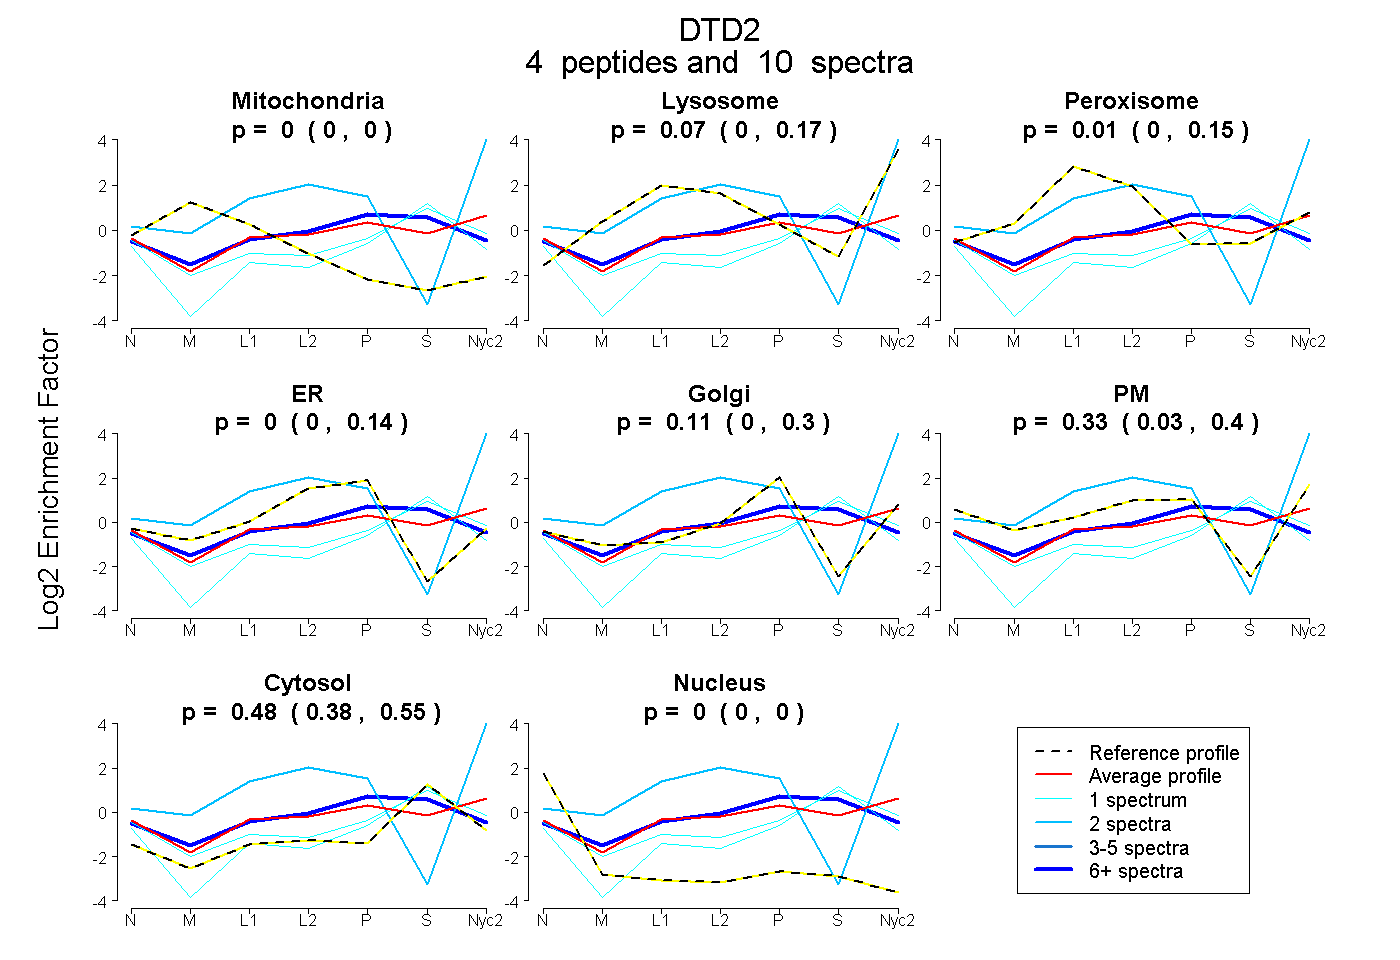
| Plot | Mito | Lyso | Perox | ER | Golgi | PM | Cytosol | Nucleus | |||||
| Expt A |
4 peptides |
10 spectra |
|
0.000 0.000 | 0.000 |
0.068 0.000 | 0.169 |
0.007 0.000 | 0.155 |
0.000 0.000 | 0.138 |
0.110 0.000 | 0.302 |
0.331 0.034 | 0.400 |
0.484 0.382 | 0.545 |
0.000 0.000 | 0.000 |
||
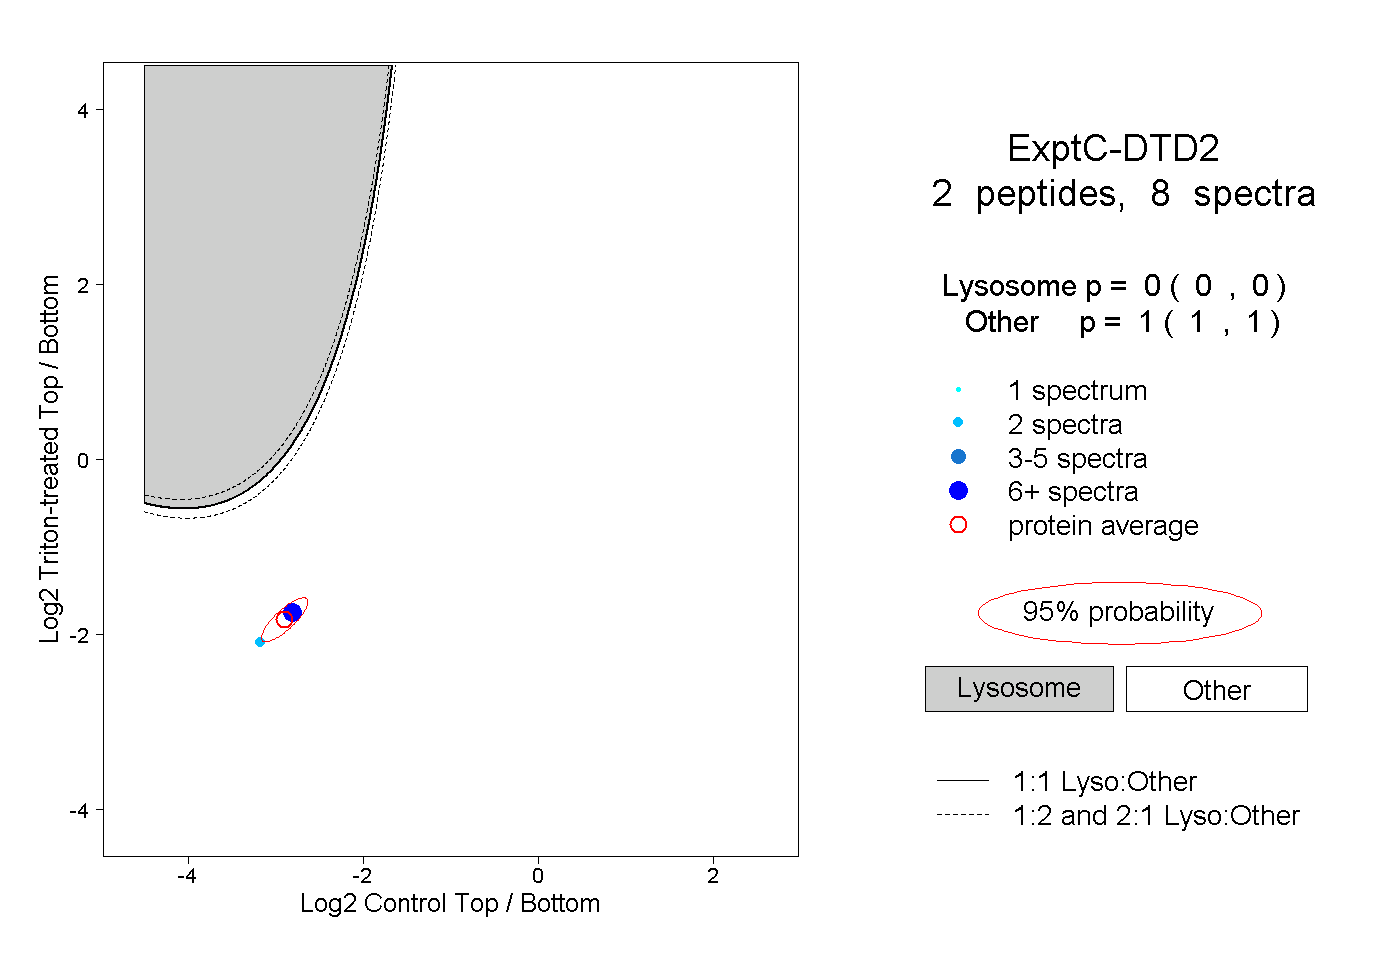
| Plot | Lyso | Other | |||||||||||
| Expt C |
2 peptides |
8 spectra |
|
0.000 0.000 | 0.000 |
1.000 1.000 | 1.000 |