 1
1peptide
spectra
0.000 | 0.006
0.000 | 0.000
0.222 | 0.277
0.000 | 0.000
0.017 | 0.058
0.456 | 0.522
0.201 | 0.228
0.000 | 0.000
2peptides
spectra
0.000 | 0.000
1.000 | 1.000
| Plot | Mito | Lyso | Perox | ER | Golgi | PM | Cytosol | Nucleus | |||||
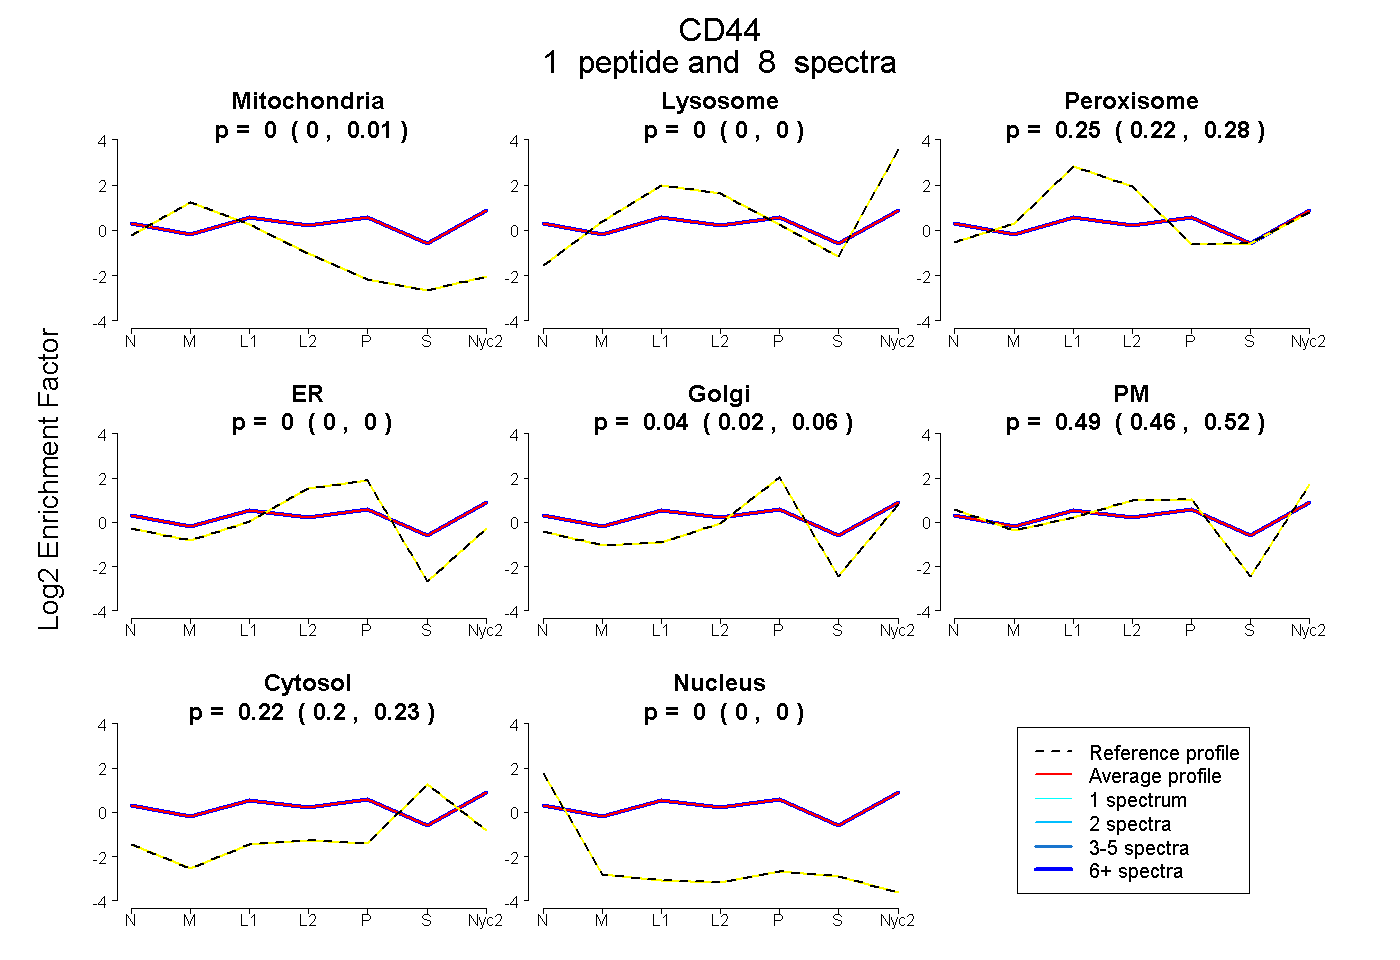
| Expt A |
1 peptide |
8 spectra |
|
0.000 0.000 | 0.006 |
0.000 0.000 | 0.000 |
0.252 0.222 | 0.277 |
0.000 0.000 | 0.000 |
0.040 0.017 | 0.058 |
0.492 0.456 | 0.522 |
0.216 0.201 | 0.228 |
0.000 0.000 | 0.000 |
||
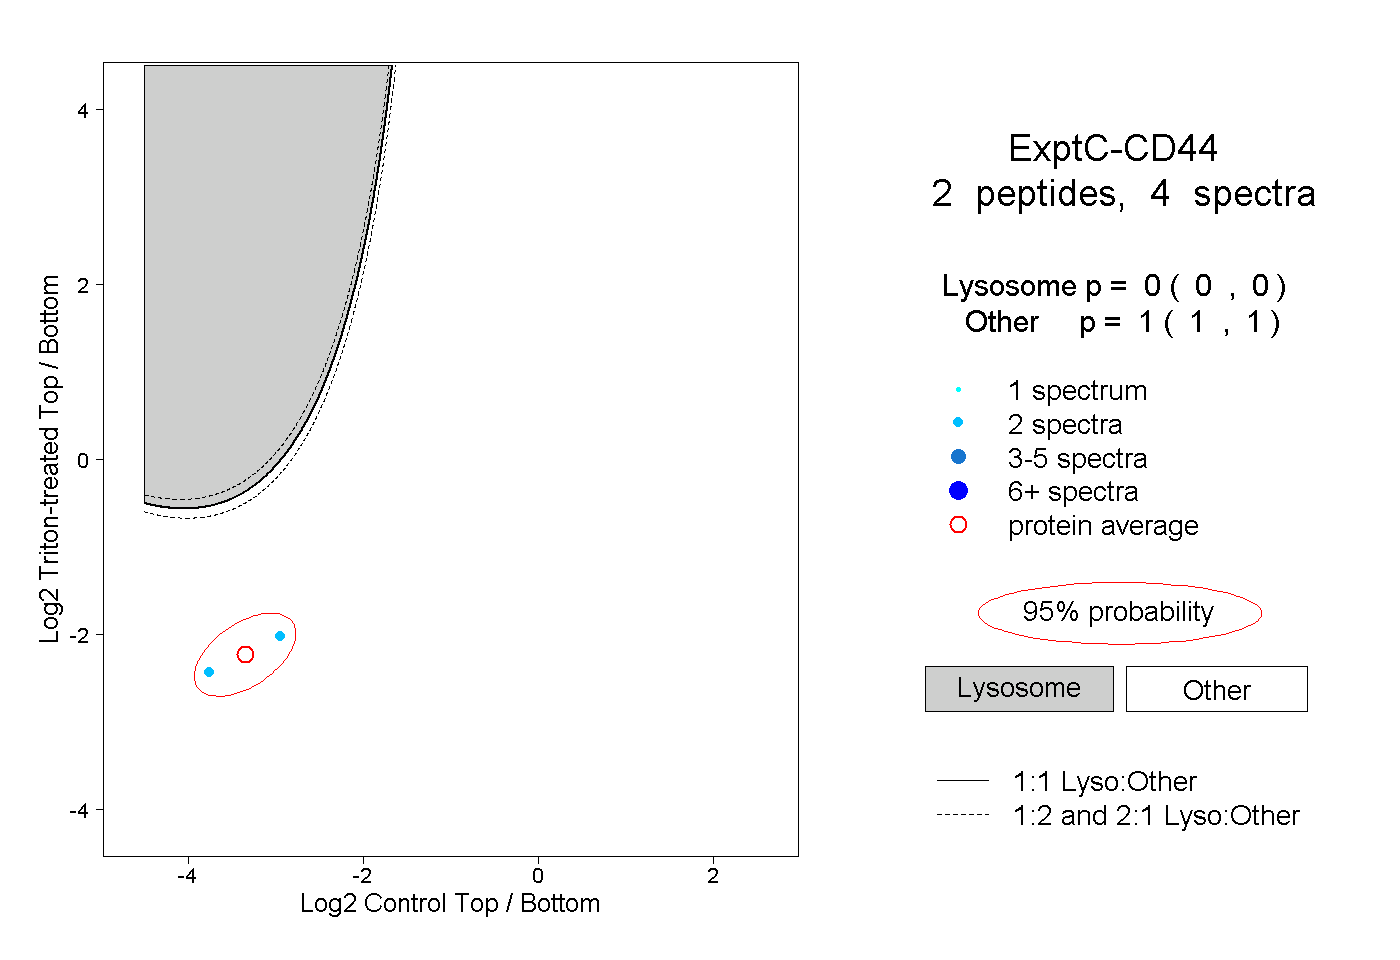
| Plot | Lyso | Other | |||||||||||
| Expt C |
2 peptides |
4 spectra |
|
0.000 0.000 | 0.000 |
1.000 1.000 | 1.000 |