 3
3peptides
spectra
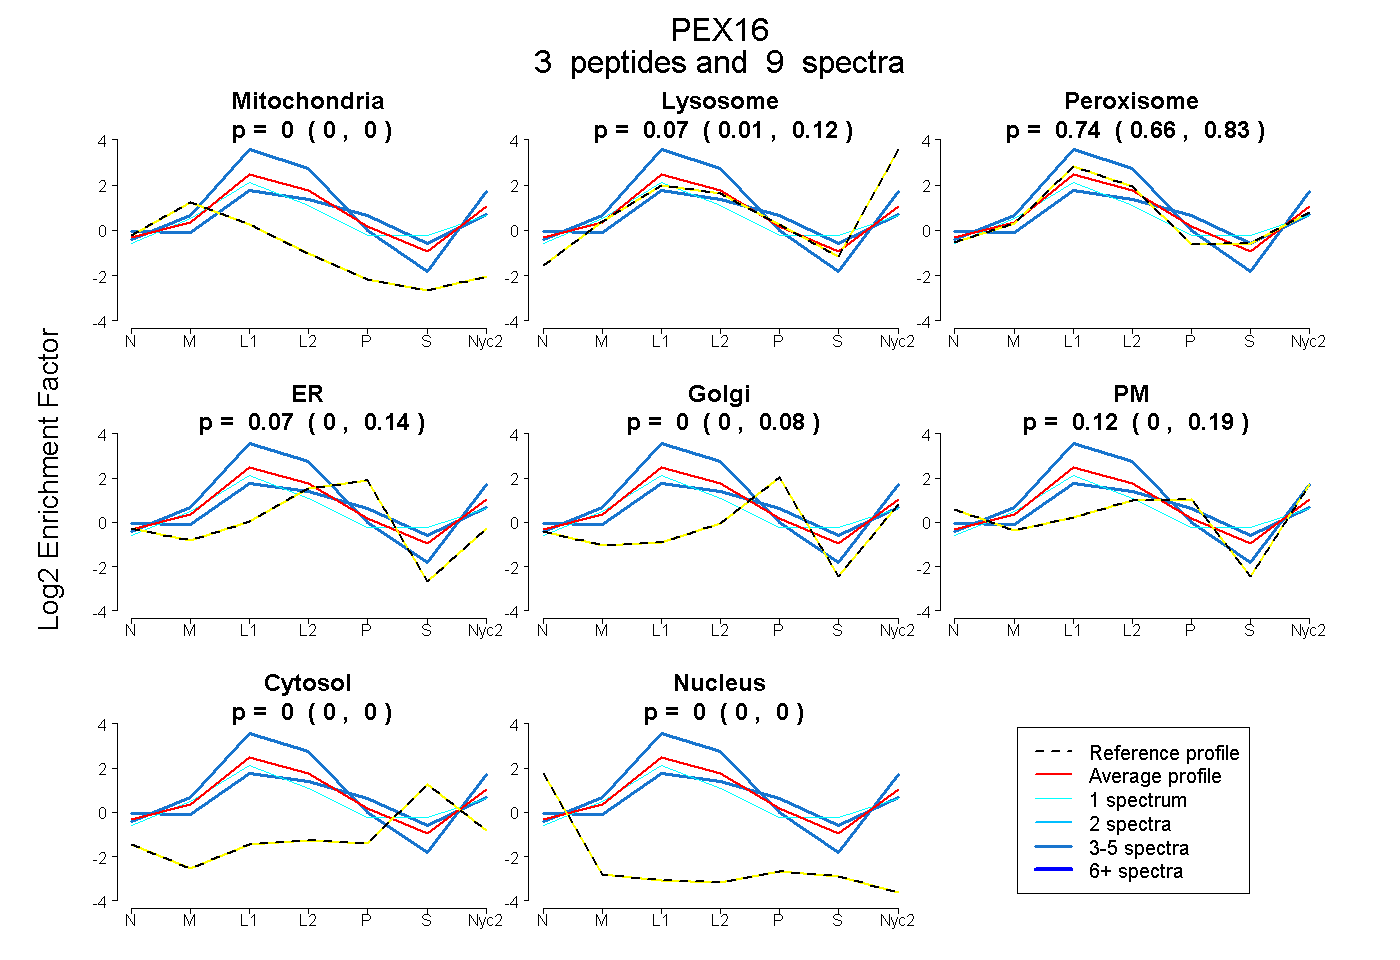
0.000 | 0.000
0.006 | 0.125
0.657 | 0.826
0.000 | 0.136
0.000 | 0.075
0.000 | 0.191
0.000 | 0.000
0.000 | 0.000
2peptides
spectra
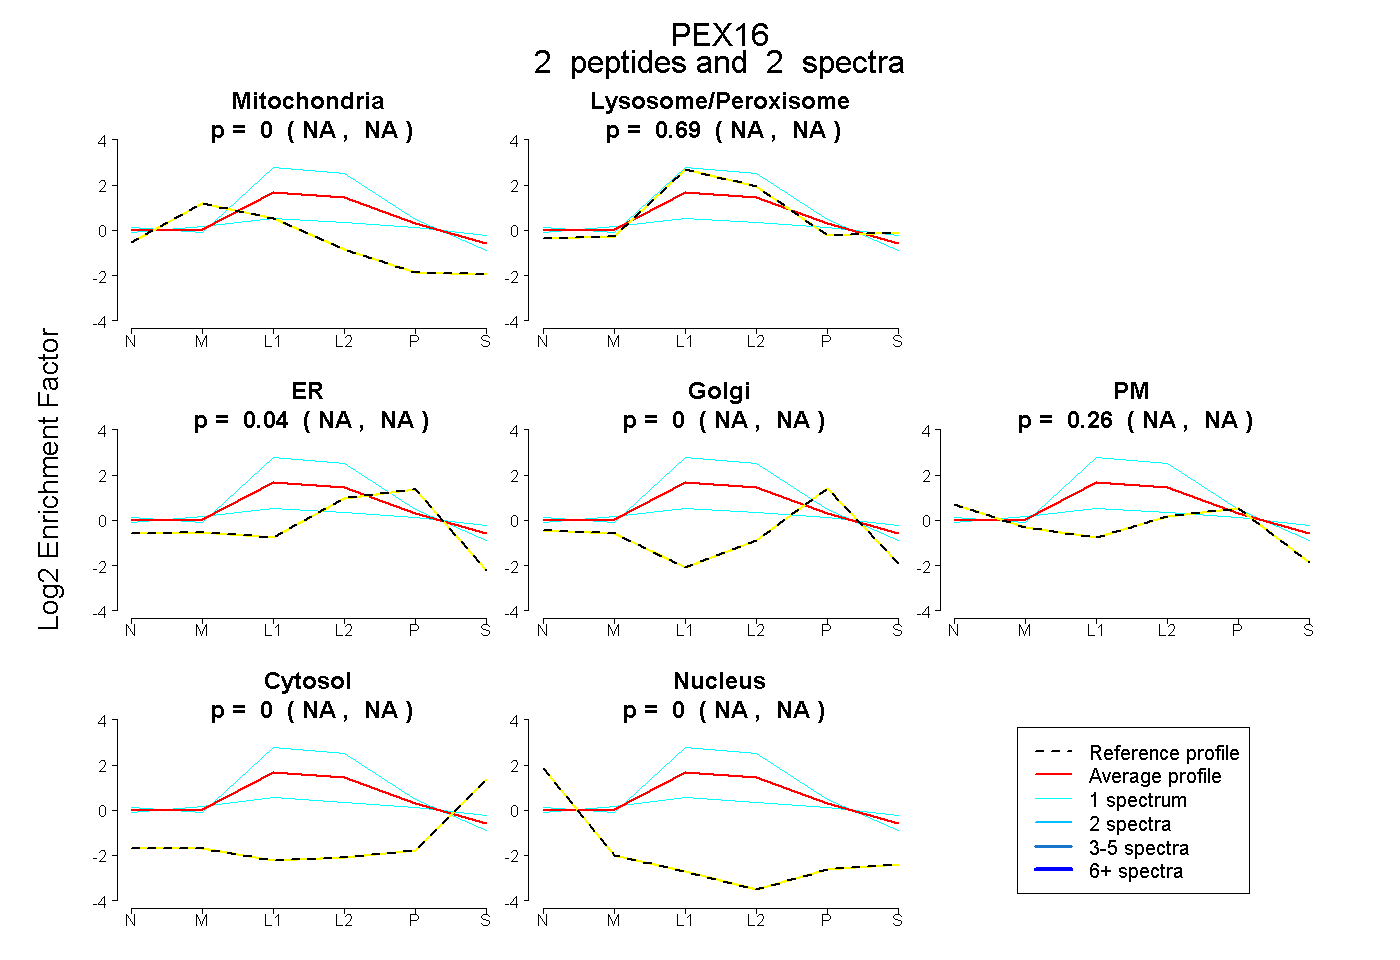
NA | NA
NA | NA
NA | NA
NA | NA
NA | NA
NA | NA
NA | NA
6peptides
spectra
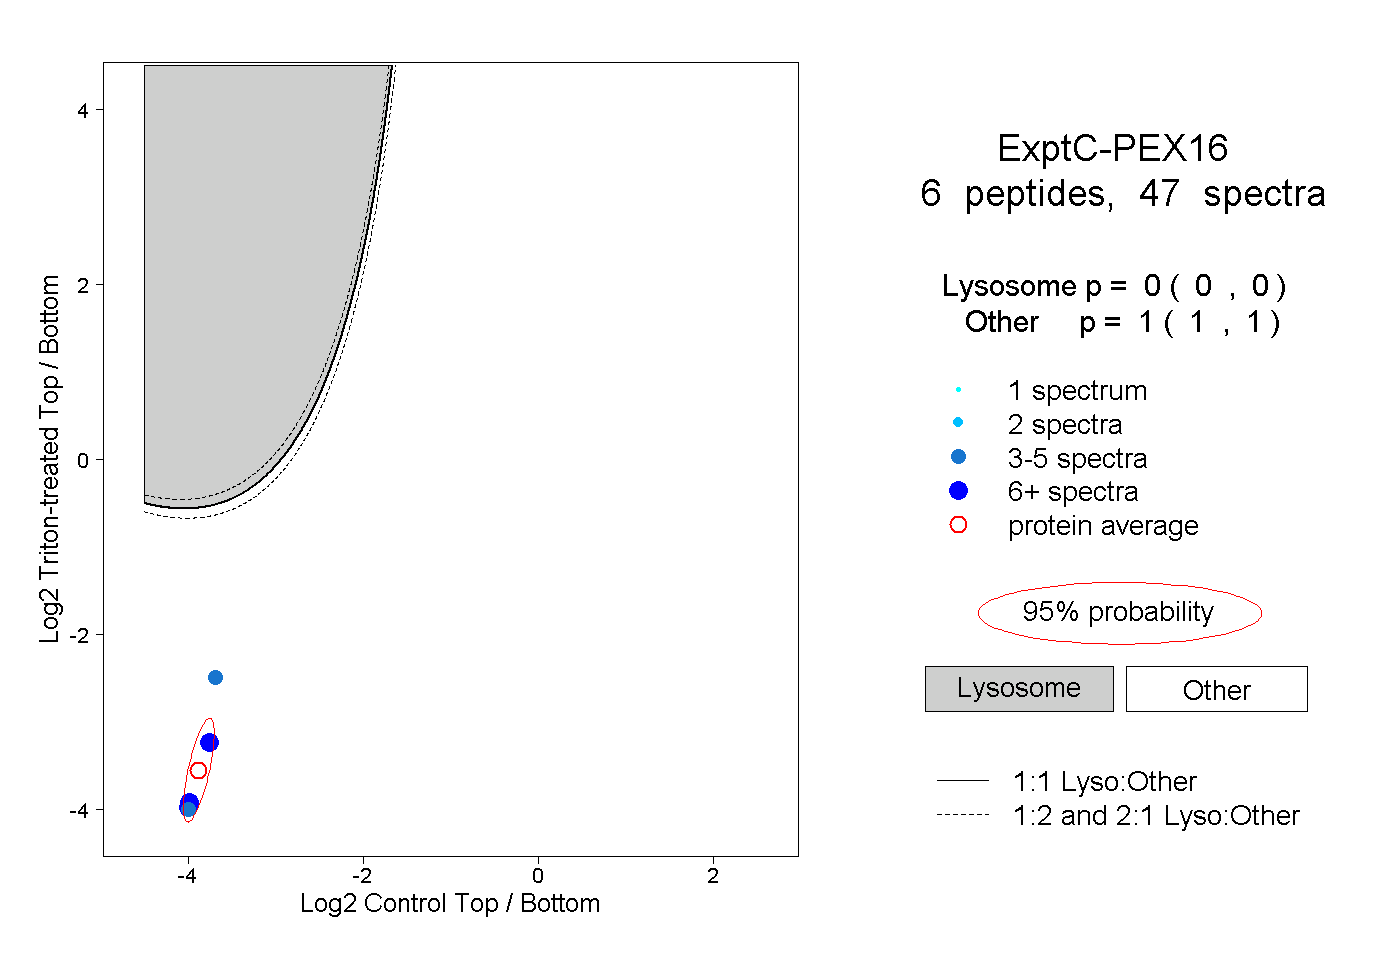
0.000 | 0.000
1.000 | 1.000