 3
3peptides
spectra
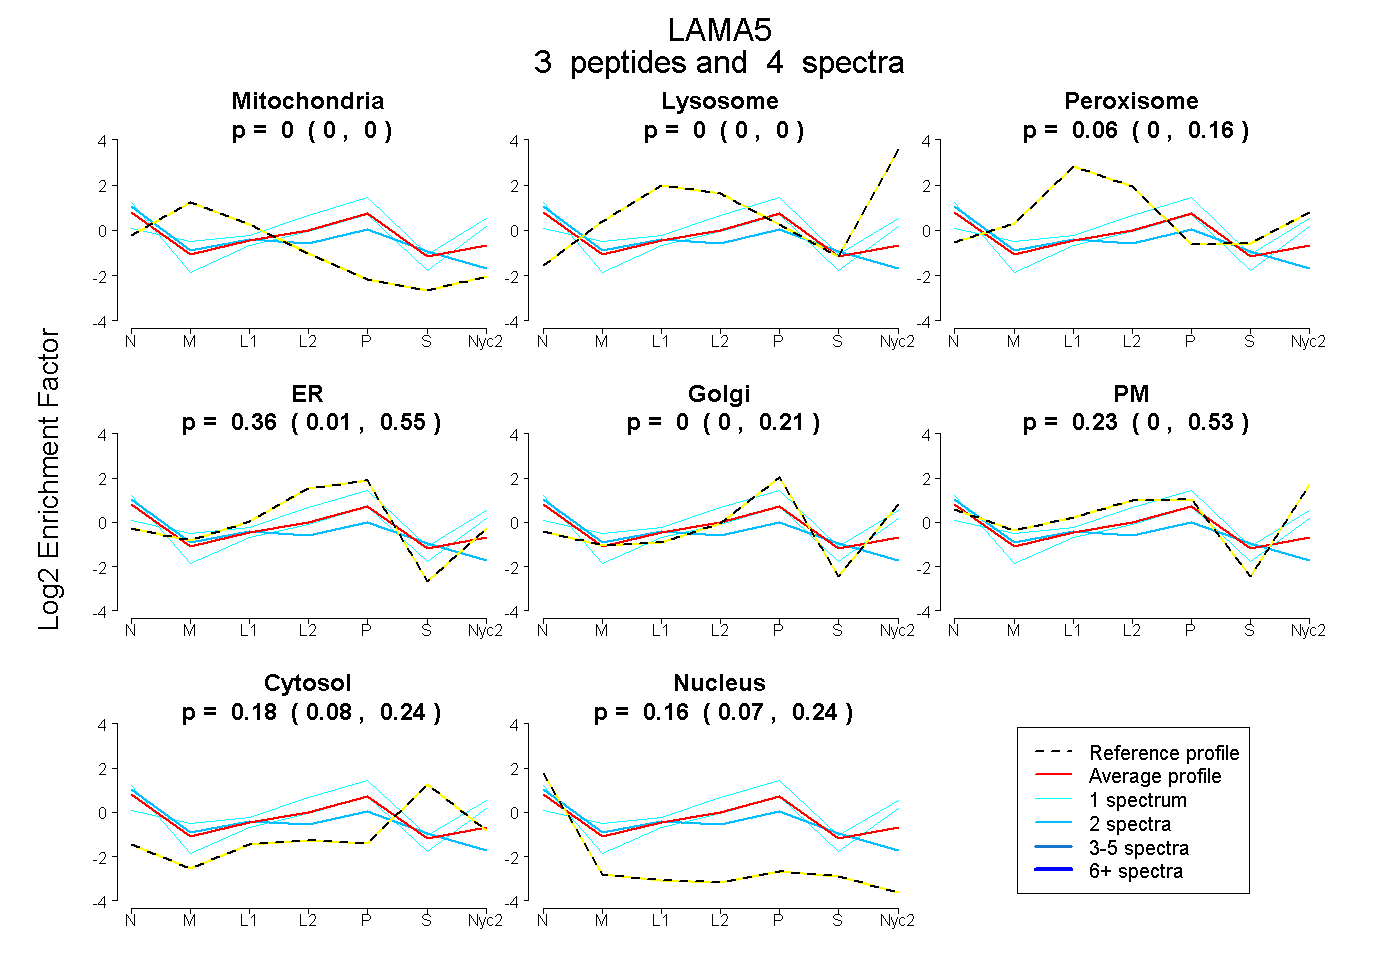
0.000 | 0.004
0.000 | 0.000
0.000 | 0.161
0.007 | 0.546
0.000 | 0.214
0.000 | 0.527
0.081 | 0.242
0.074 | 0.244
| Plot | Mito | Lyso | Perox | ER | Golgi | PM | Cytosol | Nucleus | |||||
| Expt A |
3 peptides |
4 spectra |
|
0.000 0.000 | 0.004 |
0.000 0.000 | 0.000 |
0.057 0.000 | 0.161 |
0.362 0.007 | 0.546 |
0.000 0.000 | 0.214 |
0.233 0.000 | 0.527 |
0.184 0.081 | 0.242 |
0.164 0.074 | 0.244 |
| 1 spectrum, GIAQAR | 0.000 | 0.000 | 0.132 | 0.174 | 0.332 | 0.229 | 0.134 | 0.000 | ||
| 2 spectra, HPQGTVVFTTQVPTLGR | 0.000 | 0.000 | 0.248 | 0.291 | 0.000 | 0.000 | 0.119 | 0.341 | ||
| 1 spectrum, GDTVAPGR | 0.000 | 0.000 | 0.000 | 0.056 | 0.118 | 0.525 | 0.100 | 0.201 |
| Plot | Lyso | Other | |||||||||||
| Expt C |
1 peptide |
1 spectrum |
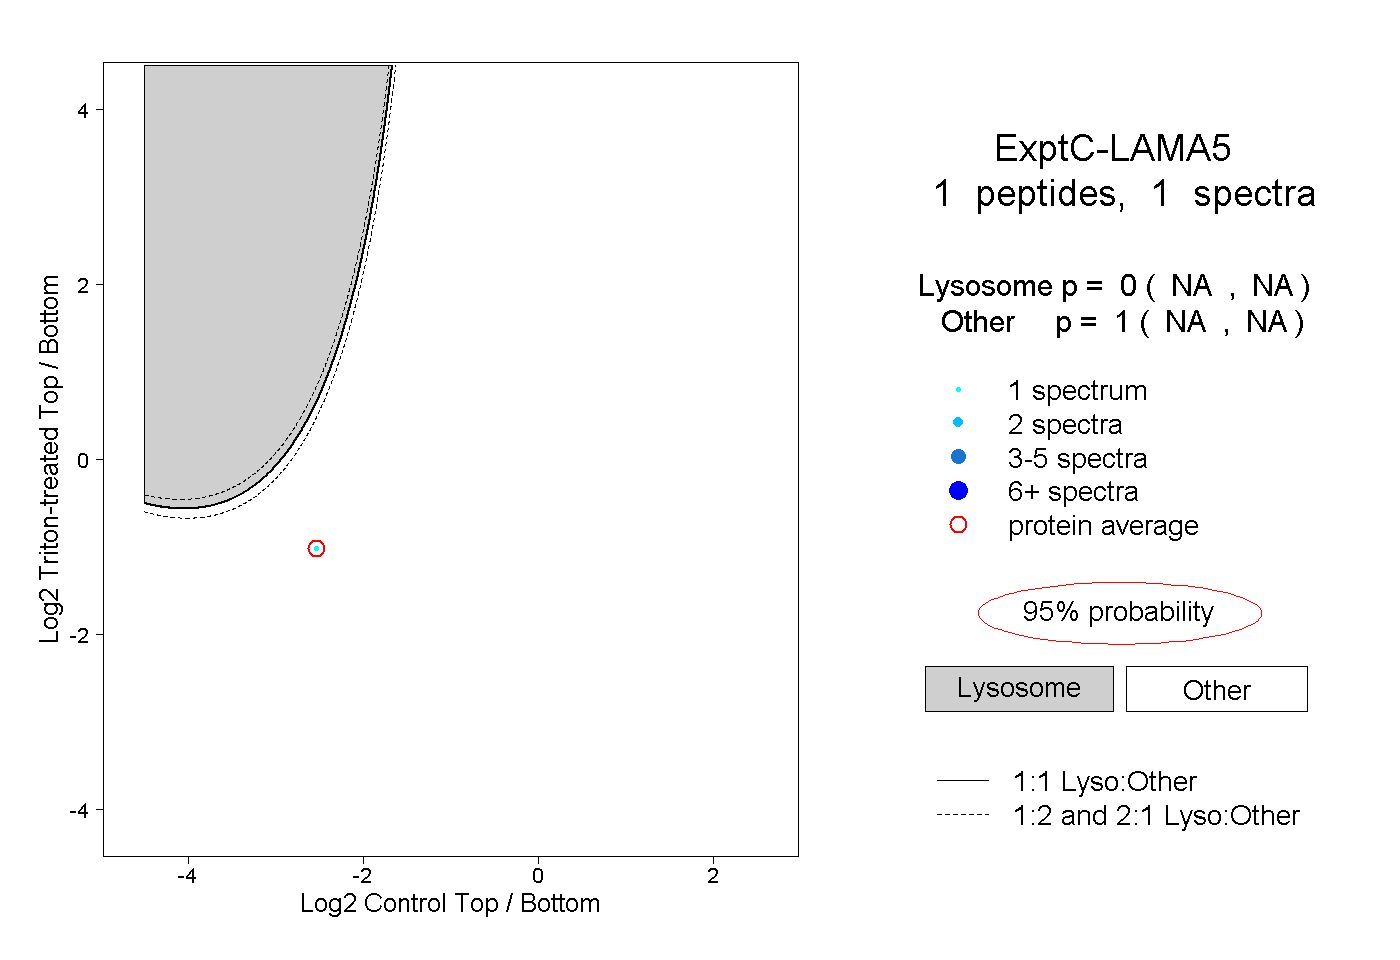 |
0.000 NA | NA |
1.000 NA | NA |