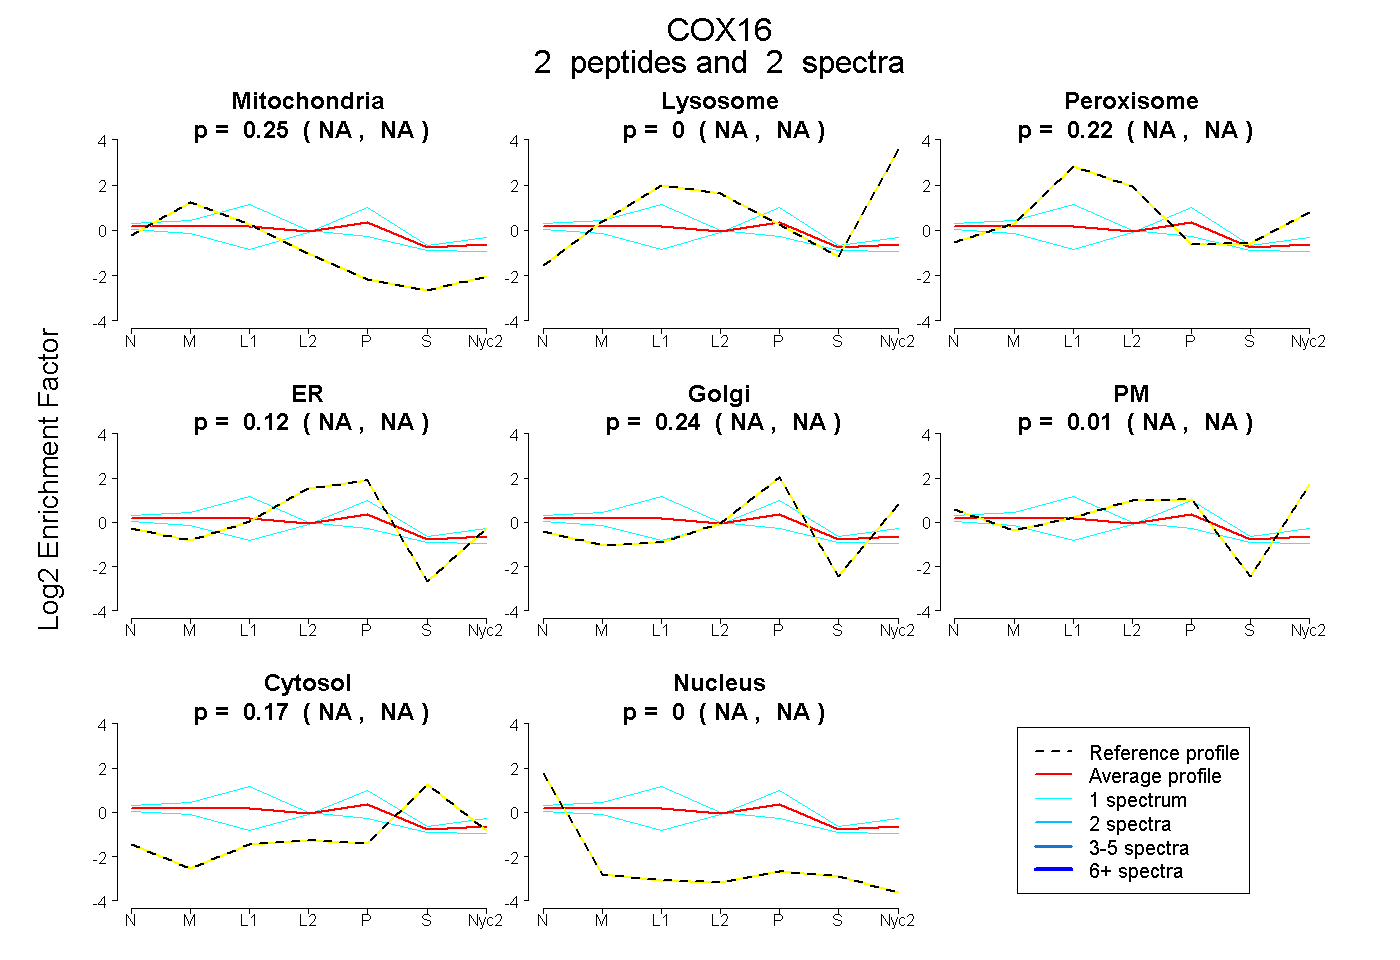
 2
2peptides
spectra
NA | NA
NA | NA
NA | NA
NA | NA
NA | NA
NA | NA
NA | NA
NA | NA
| Plot | Mito | Lyso | Perox | ER | Golgi | PM | Cytosol | Nucleus | |||||
| Expt A |
2 peptides |
2 spectra |
|
0.247 NA | NA |
0.000 NA | NA |
0.216 NA | NA |
0.122 NA | NA |
0.239 NA | NA |
0.008 NA | NA |
0.167 NA | NA |
0.000 NA | NA |
| 1 spectrum, MVAPAVLR | 0.123 | 0.000 | 0.045 | 0.136 | 0.373 | 0.078 | 0.246 | 0.000 | ||
| 1 spectrum, GPRPWEDPQLLQGR | 0.306 | 0.000 | 0.430 | 0.082 | 0.062 | 0.000 | 0.058 | 0.062 |
| Plot | Mito | Lyso or Perox | ER | Golgi | PM | Cytosol | Nucleus | ||||||
| Expt B |
1 peptide |
2 spectra |
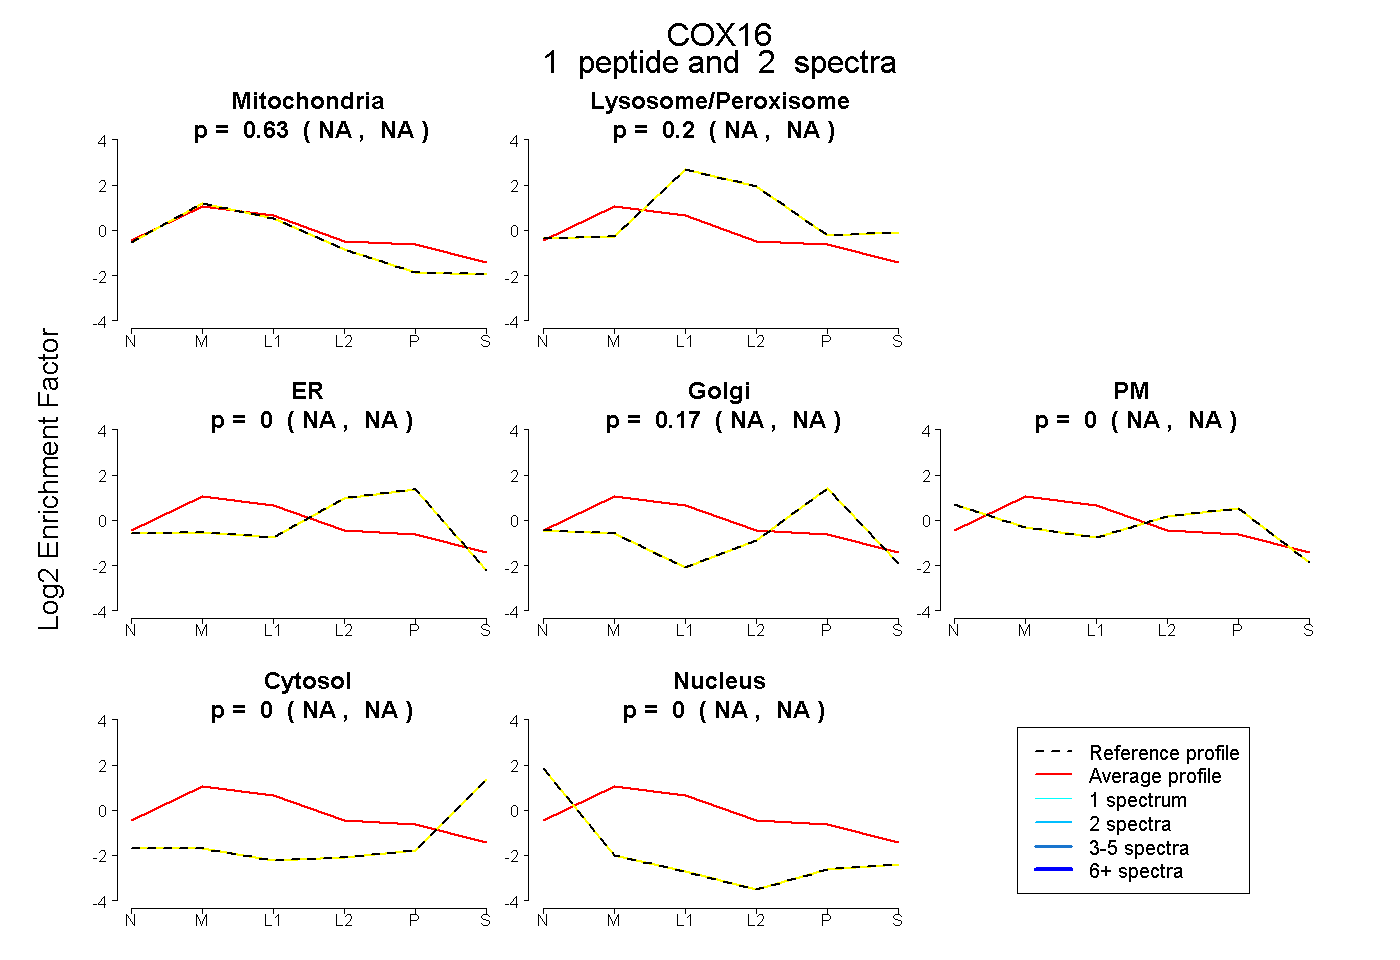 |
0.633 NA | NA |
0.198 NA | NA |
0.000 NA | NA |
0.169 NA | NA |
0.000 NA | NA |
0.000 NA | NA |
0.000 NA | NA |
|||
| Plot | Lyso | Other | |||||||||||
| Expt C |
6 peptides |
12 spectra |
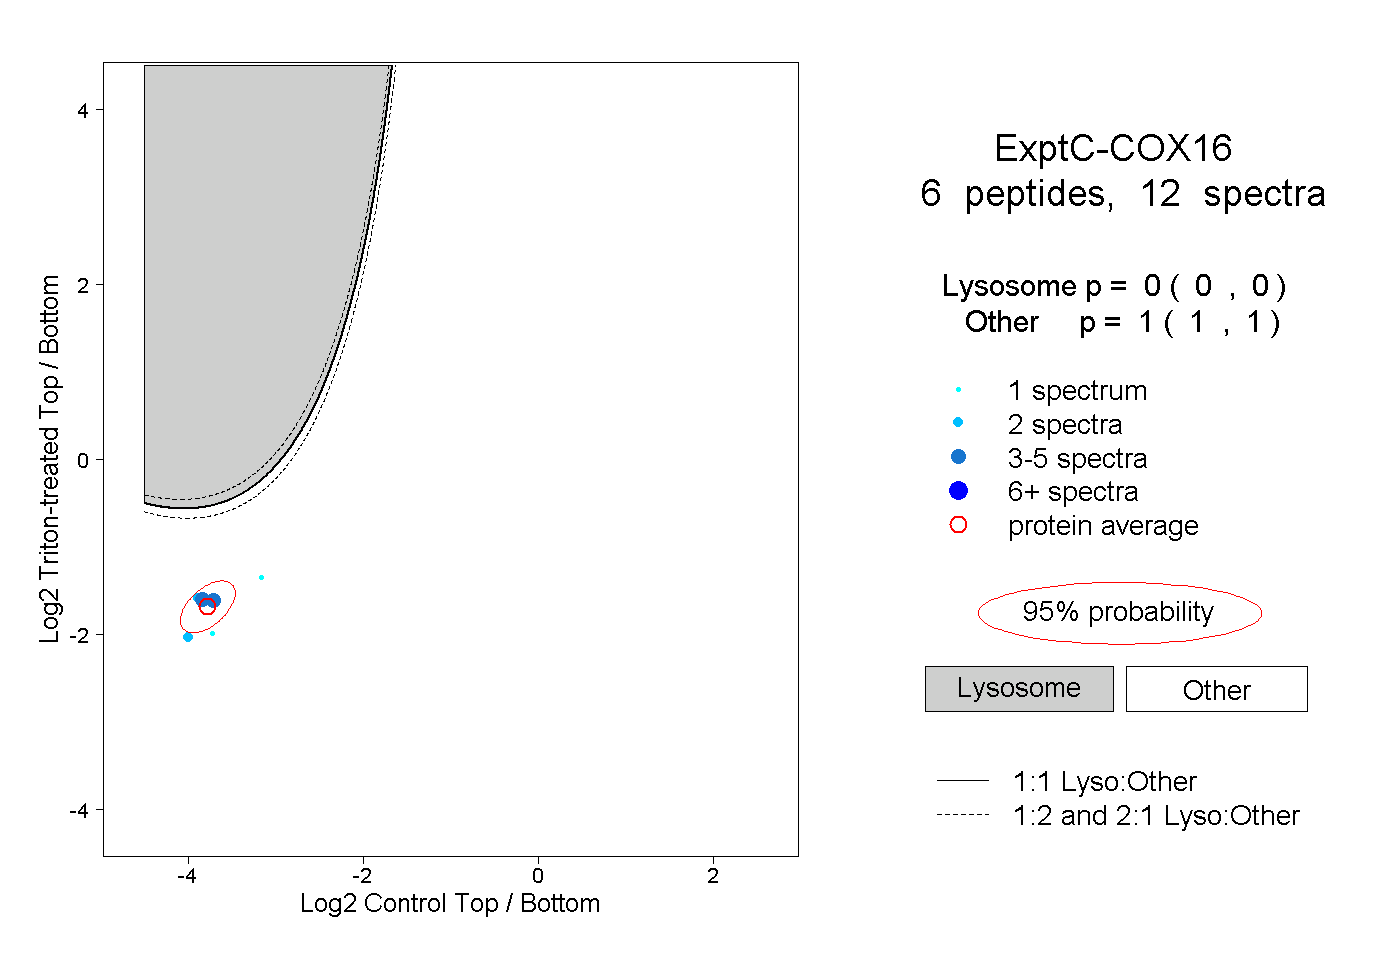 |
0.000 0.000 | 0.000 |
1.000 1.000 | 1.000 |