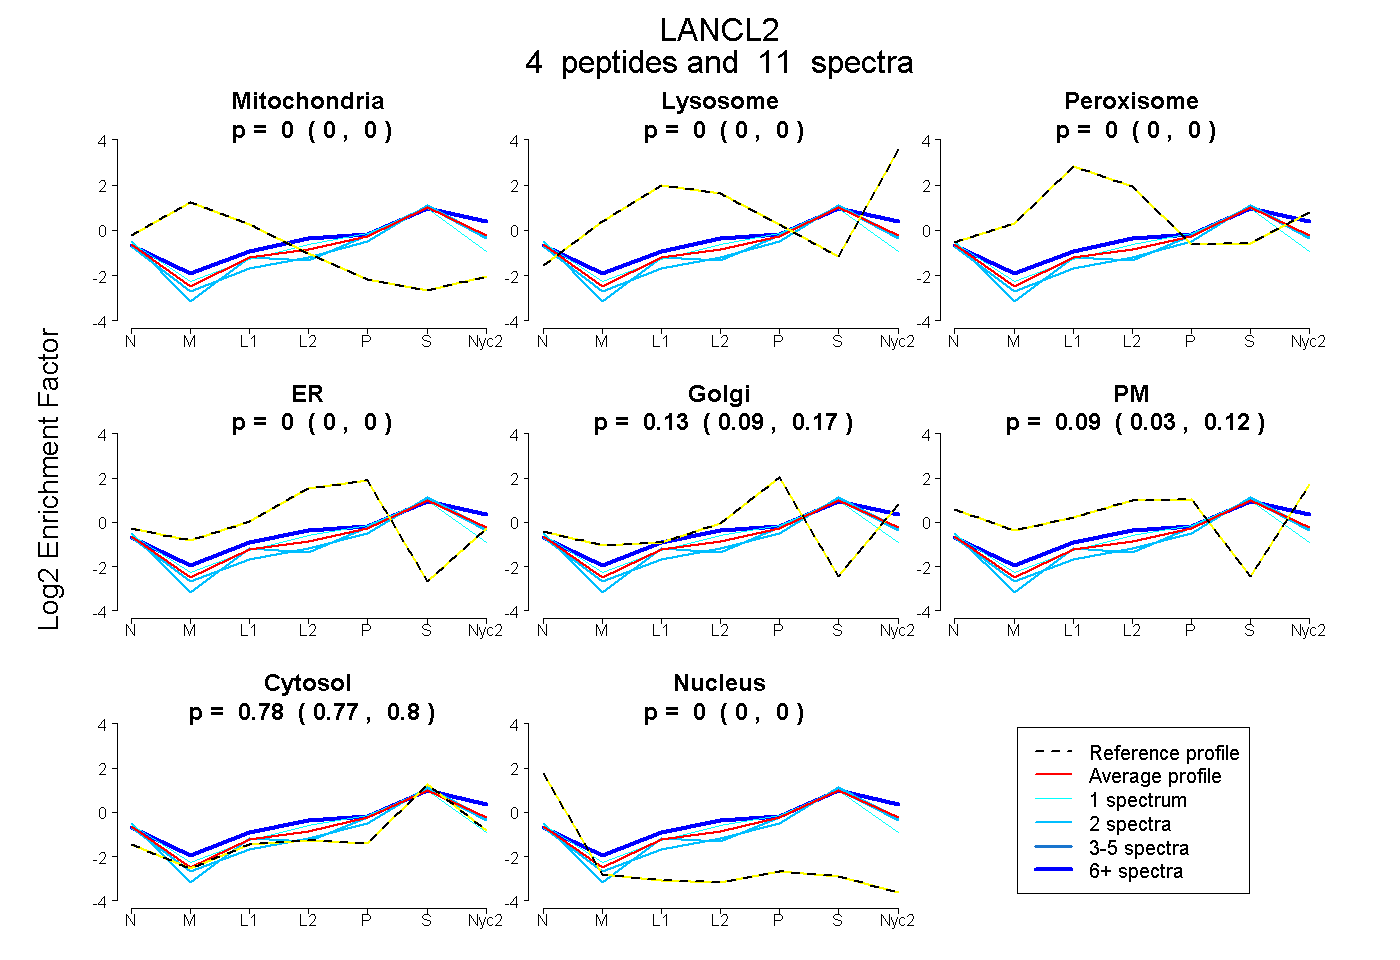
 4
4peptides
spectra
0.000 | 0.000
0.000 | 0.000
0.000 | 0.000
0.000 | 0.000
0.087 | 0.167
0.033 | 0.123
0.774 | 0.796
0.000 | 0.000
| Plot | Mito | Lyso | Perox | ER | Golgi | PM | Cytosol | Nucleus | |||||
| Expt A |
4 peptides |
11 spectra |
|
0.000 0.000 | 0.000 |
0.000 0.000 | 0.000 |
0.000 0.000 | 0.000 |
0.000 0.000 | 0.000 |
0.129 0.087 | 0.167 |
0.086 0.033 | 0.123 |
0.785 0.774 | 0.796 |
0.000 0.000 | 0.000 |
| 2 spectra, SGNYPSSLSNETDR | 0.000 | 0.000 | 0.000 | 0.000 | 0.170 | 0.000 | 0.830 | 0.000 | ||
| 2 spectra, VTGDQTYLLR | 0.000 | 0.000 | 0.000 | 0.000 | 0.151 | 0.000 | 0.849 | 0.000 | ||
| 1 spectrum, VDQETLTEMVKPSIDYVR | 0.000 | 0.000 | 0.000 | 0.214 | 0.000 | 0.000 | 0.786 | 0.000 | ||
| 6 spectra, LLQMHR | 0.000 | 0.104 | 0.000 | 0.000 | 0.018 | 0.183 | 0.695 | 0.000 |
| Plot | Mito | Lyso or Perox | ER | Golgi | PM | Cytosol | Nucleus | ||||||
| Expt B |
1 peptide |
2 spectra |
 |
0.000 NA | NA |
0.152 NA | NA |
0.000 NA | NA |
0.000 NA | NA |
0.137 NA | NA |
0.692 NA | NA |
0.019 NA | NA |
|||
| Plot | Lyso | Other | |||||||||||
| Expt C |
4 peptides |
6 spectra |
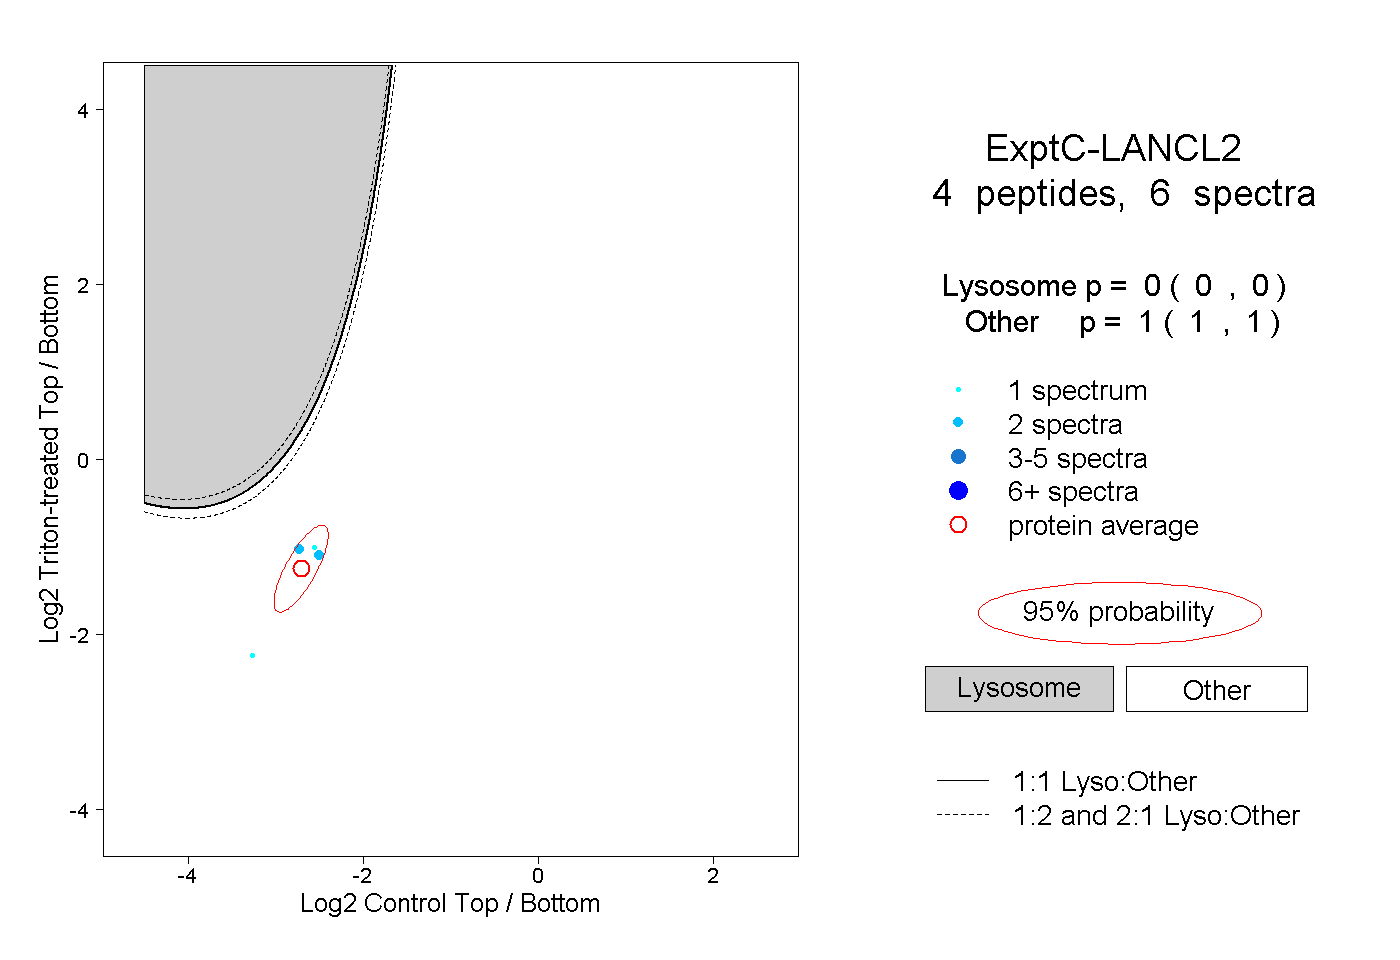 |
0.000 0.000 | 0.000 |
1.000 1.000 | 1.000 |