 9
9peptides
spectra

0.000 | 0.000
0.052 | 0.103
0.000 | 0.032
0.000 | 0.013
0.076 | 0.107
0.000 | 0.000
0.802 | 0.827
0.000 | 0.000
3peptides
spectra
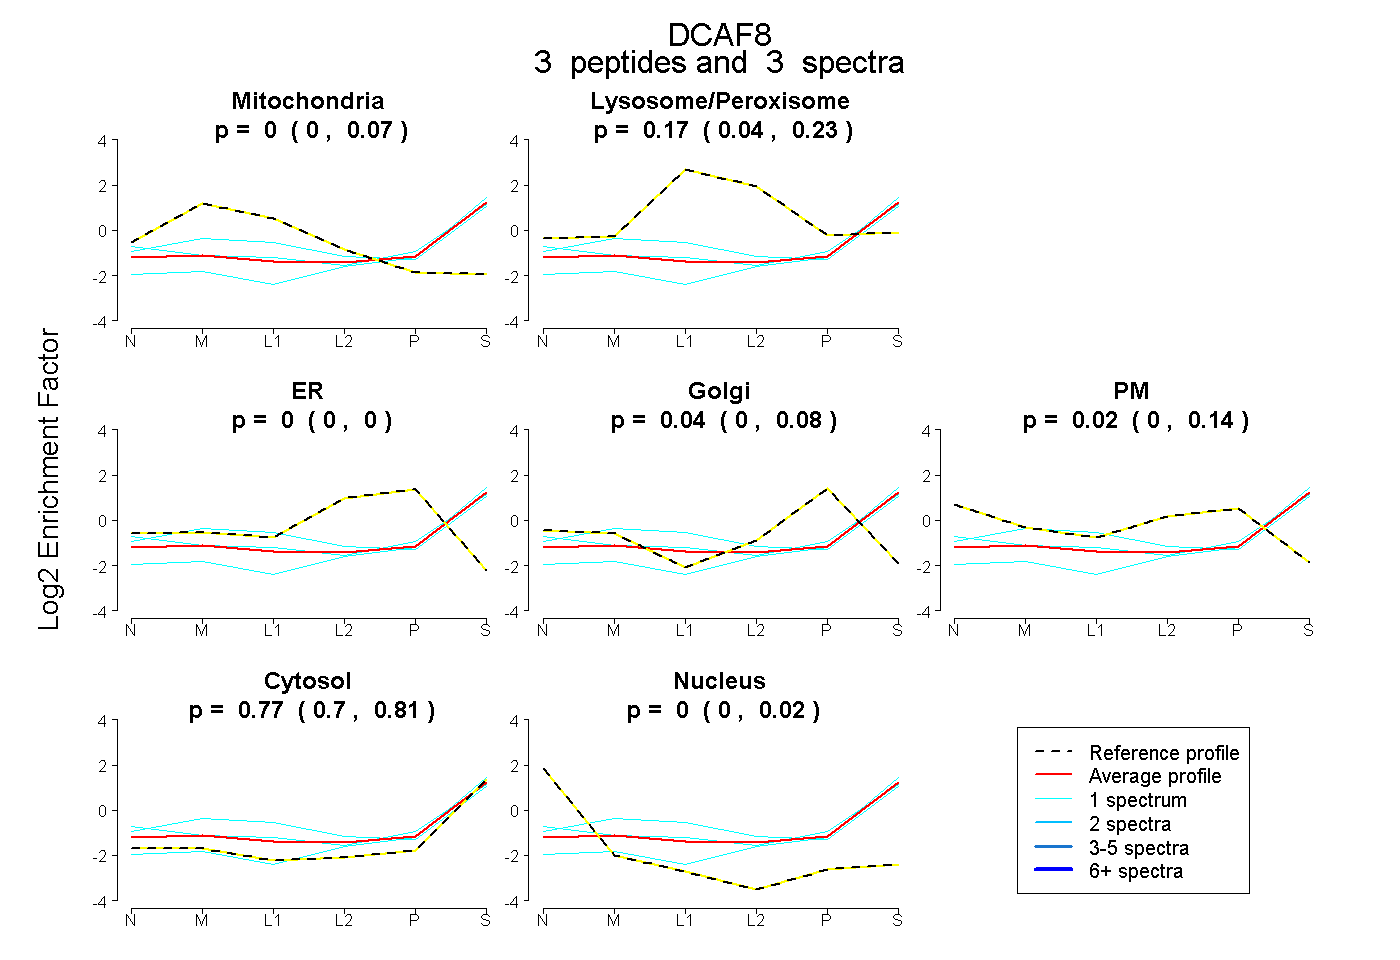
0.000 | 0.067
0.045 | 0.234
0.000 | 0.000
0.000 | 0.084
0.000 | 0.140
0.704 | 0.815
0.000 | 0.018
8peptides
spectra
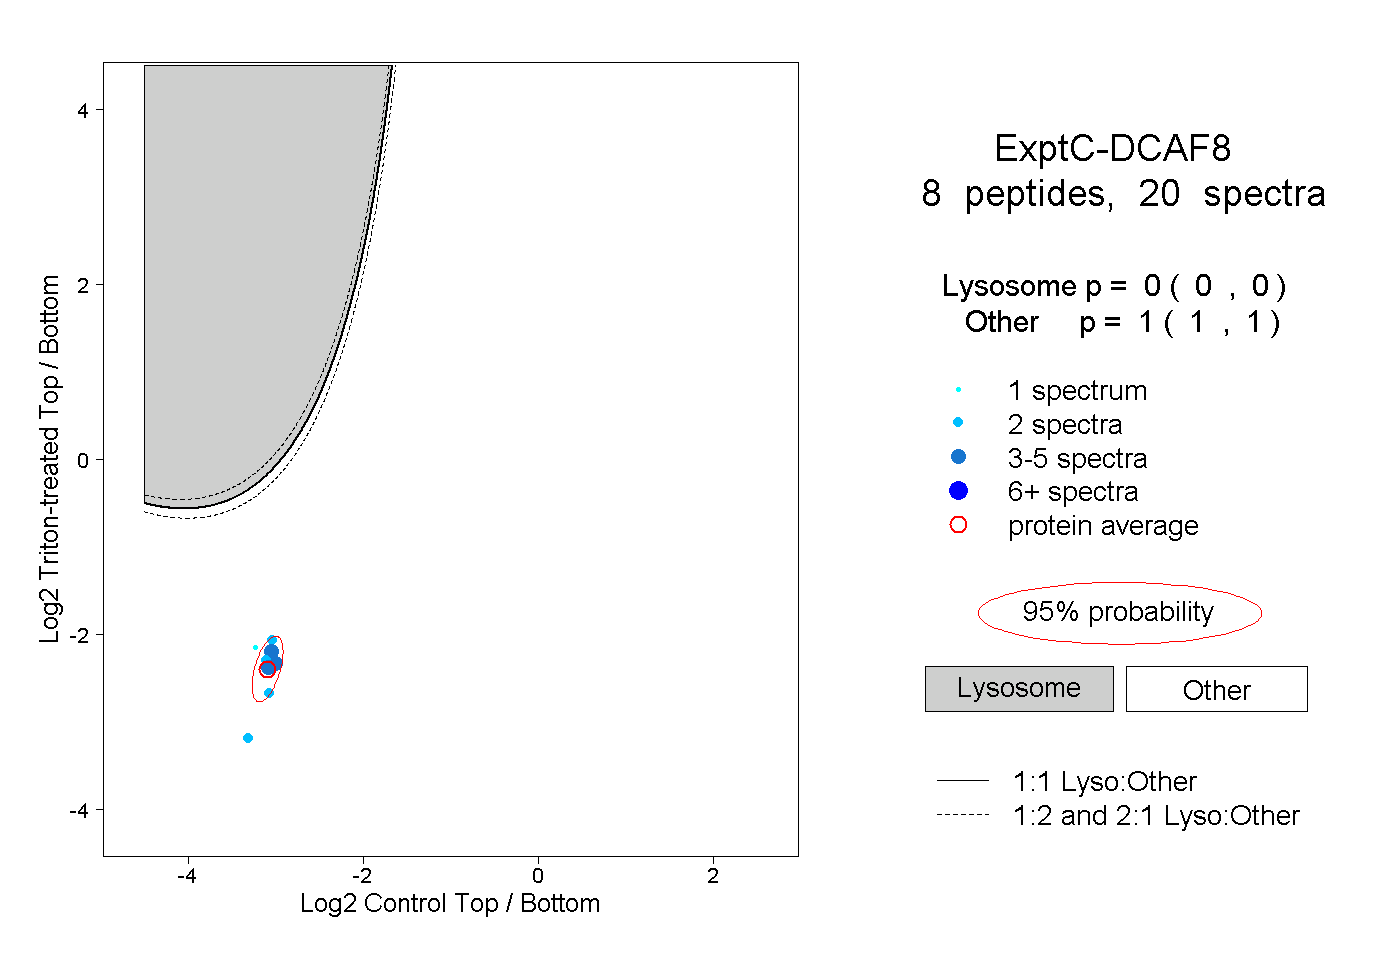
0.000 | 0.000
1.000 | 1.000
2peptides
spectra
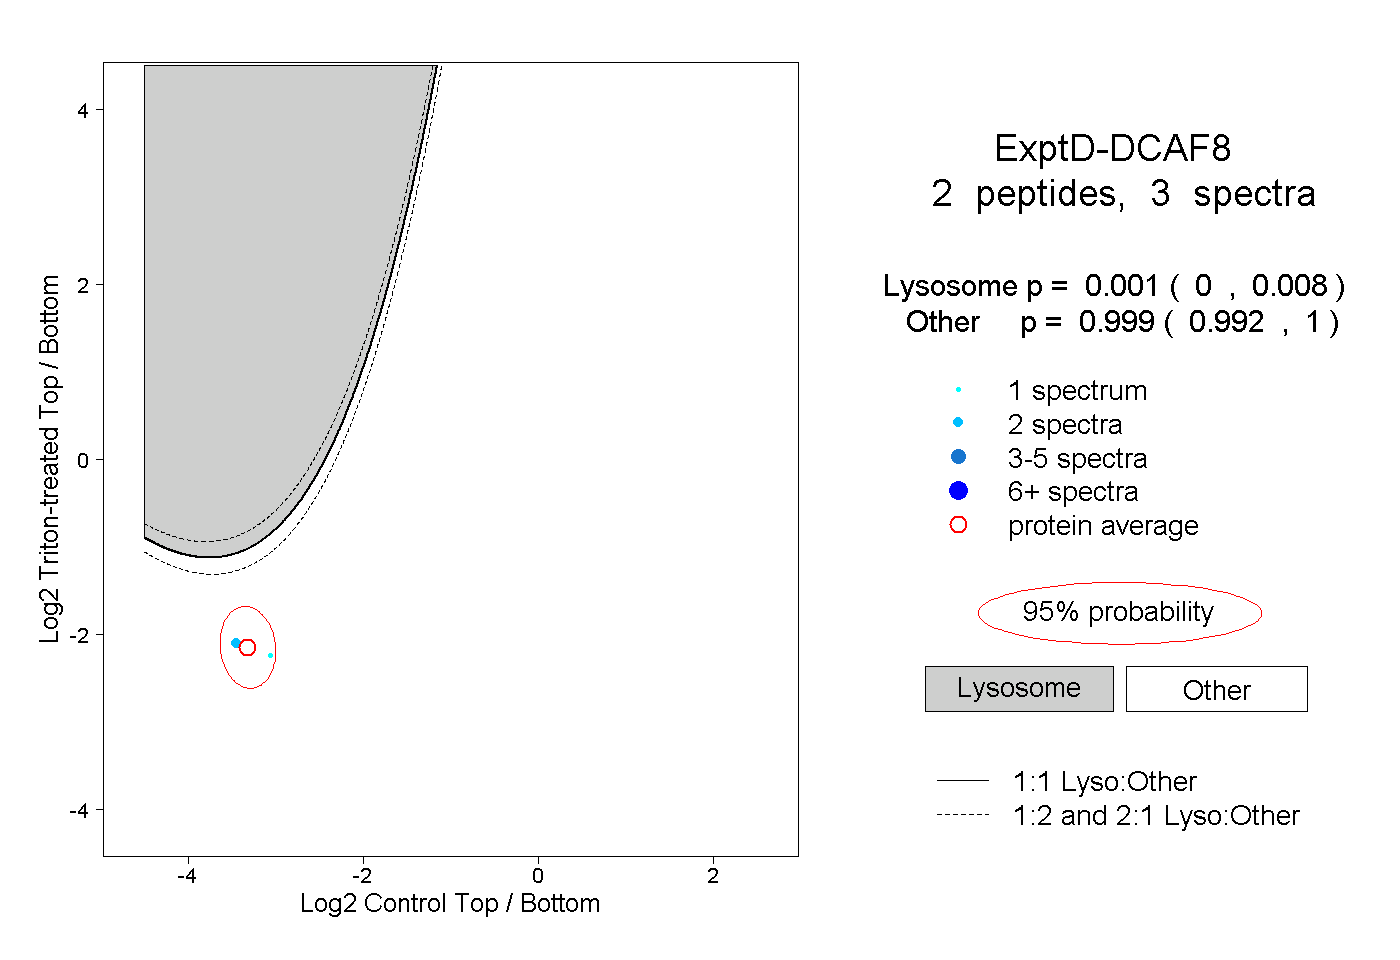
0.000 | 0.008
0.992 | 1.000