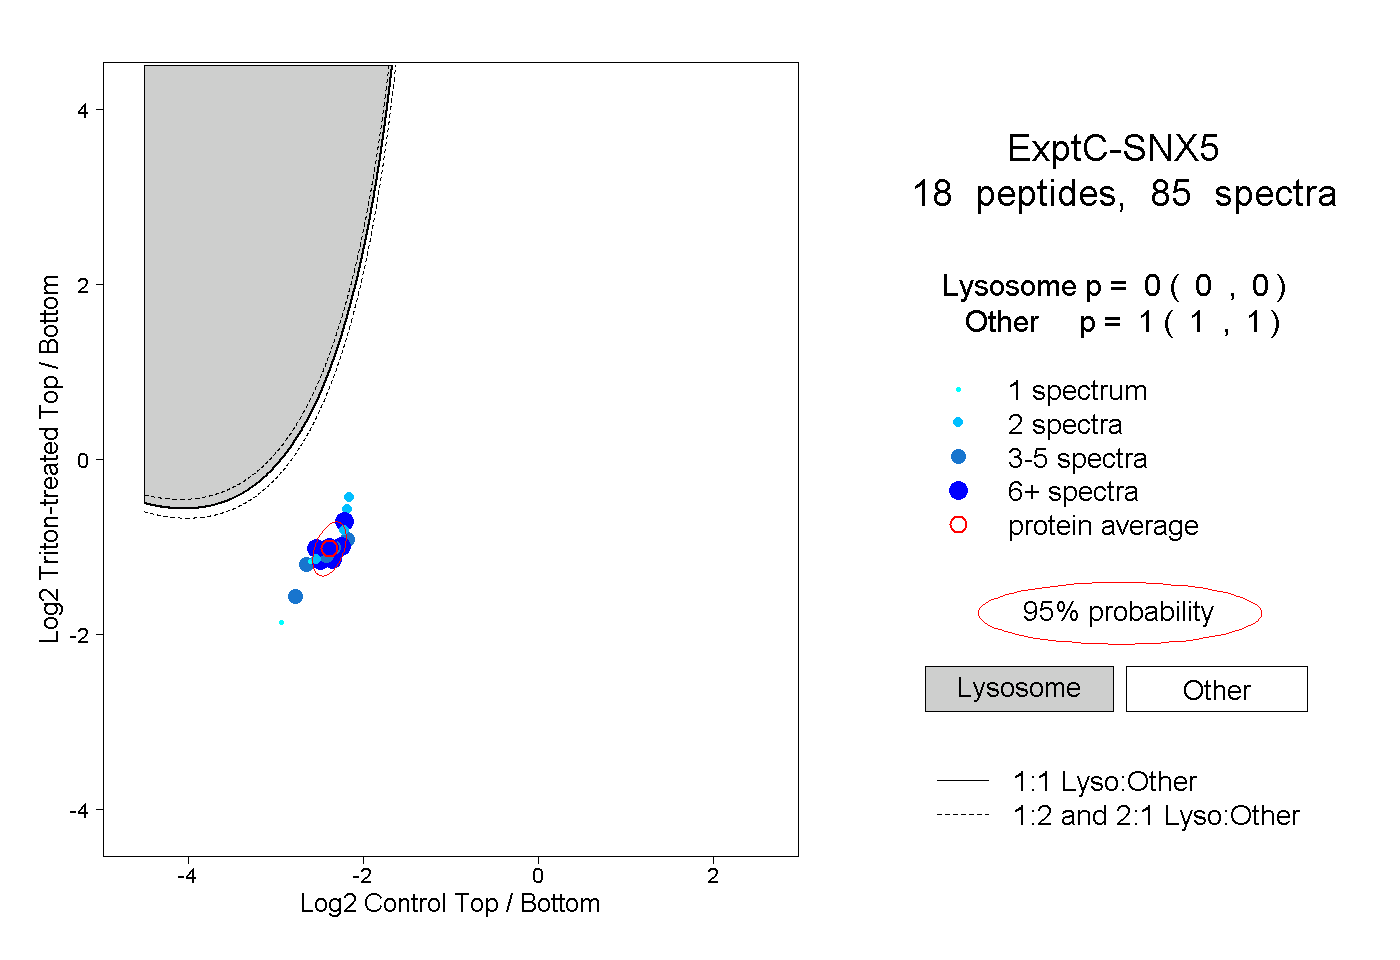
15
15peptides
spectra
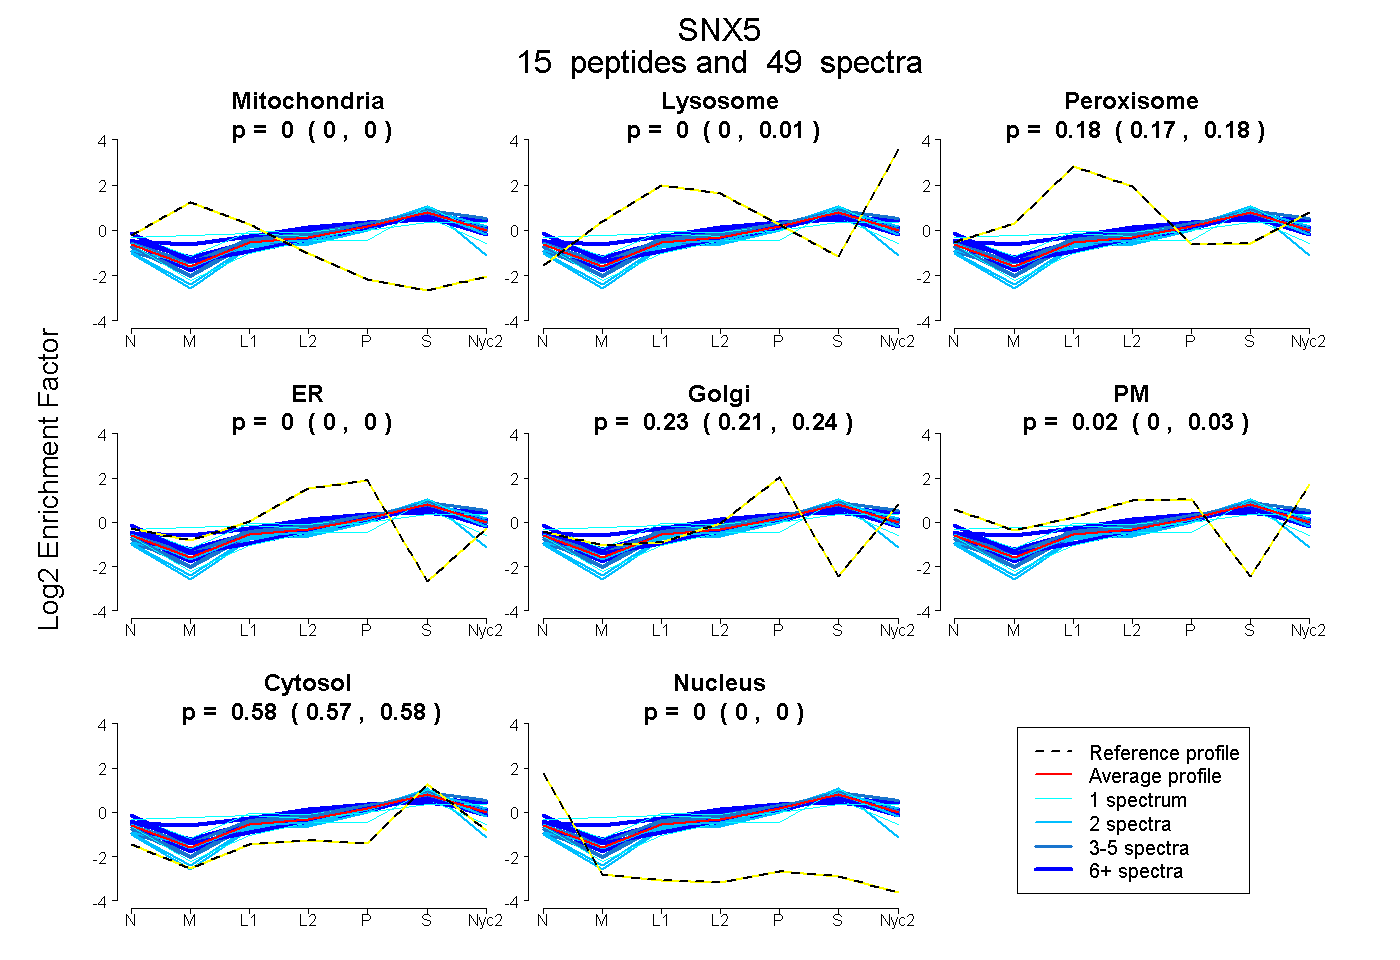
0.000 | 0.000
0.000 | 0.013
0.166 | 0.184
0.000 | 0.000
0.215 | 0.237
0.001 | 0.028
0.572 | 0.580
0.000 | 0.000
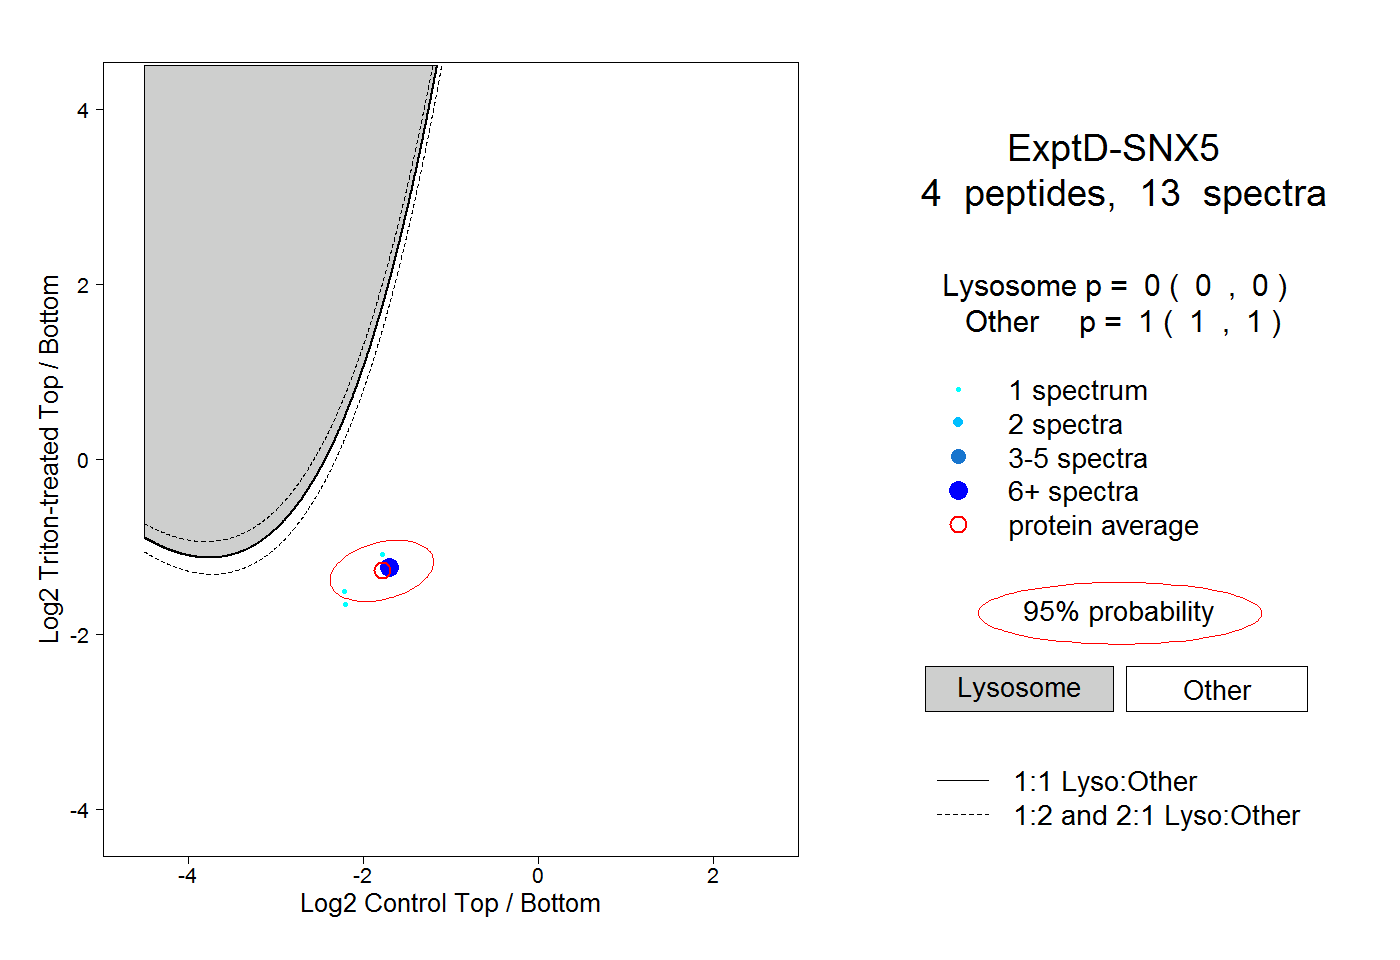
4peptides
spectra
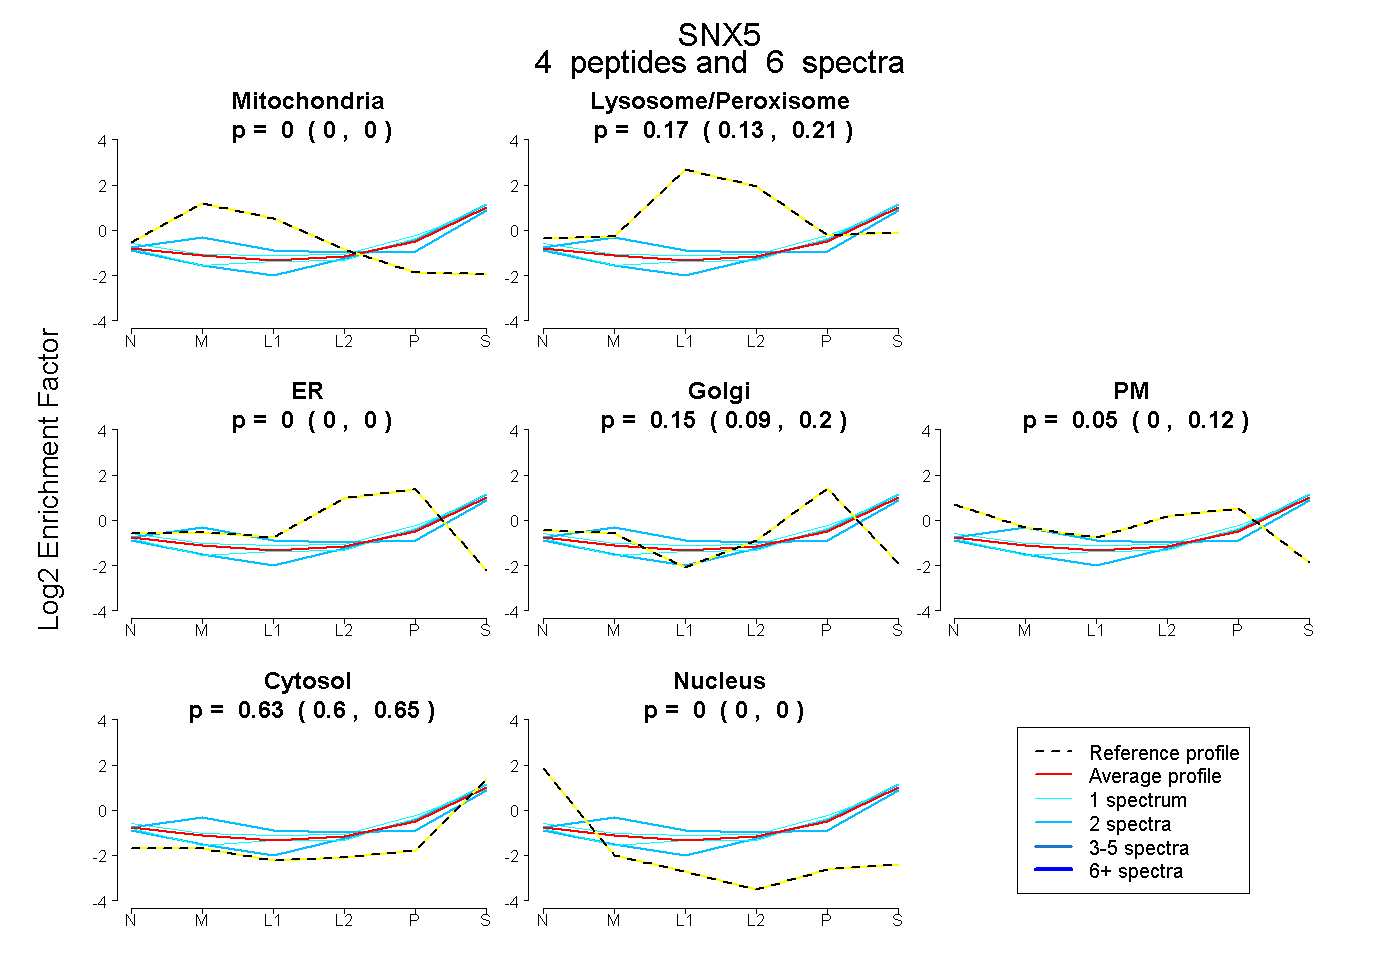
0.000 | 0.000
0.130 | 0.206
0.000 | 0.000
0.085 | 0.202
0.000 | 0.116
0.601 | 0.649
0.000 | 0.000