 15
15peptides
spectra
0.000 | 0.000
0.000 | 0.013
0.166 | 0.184
0.000 | 0.000
0.215 | 0.237
0.001 | 0.028
0.572 | 0.580
0.000 | 0.000
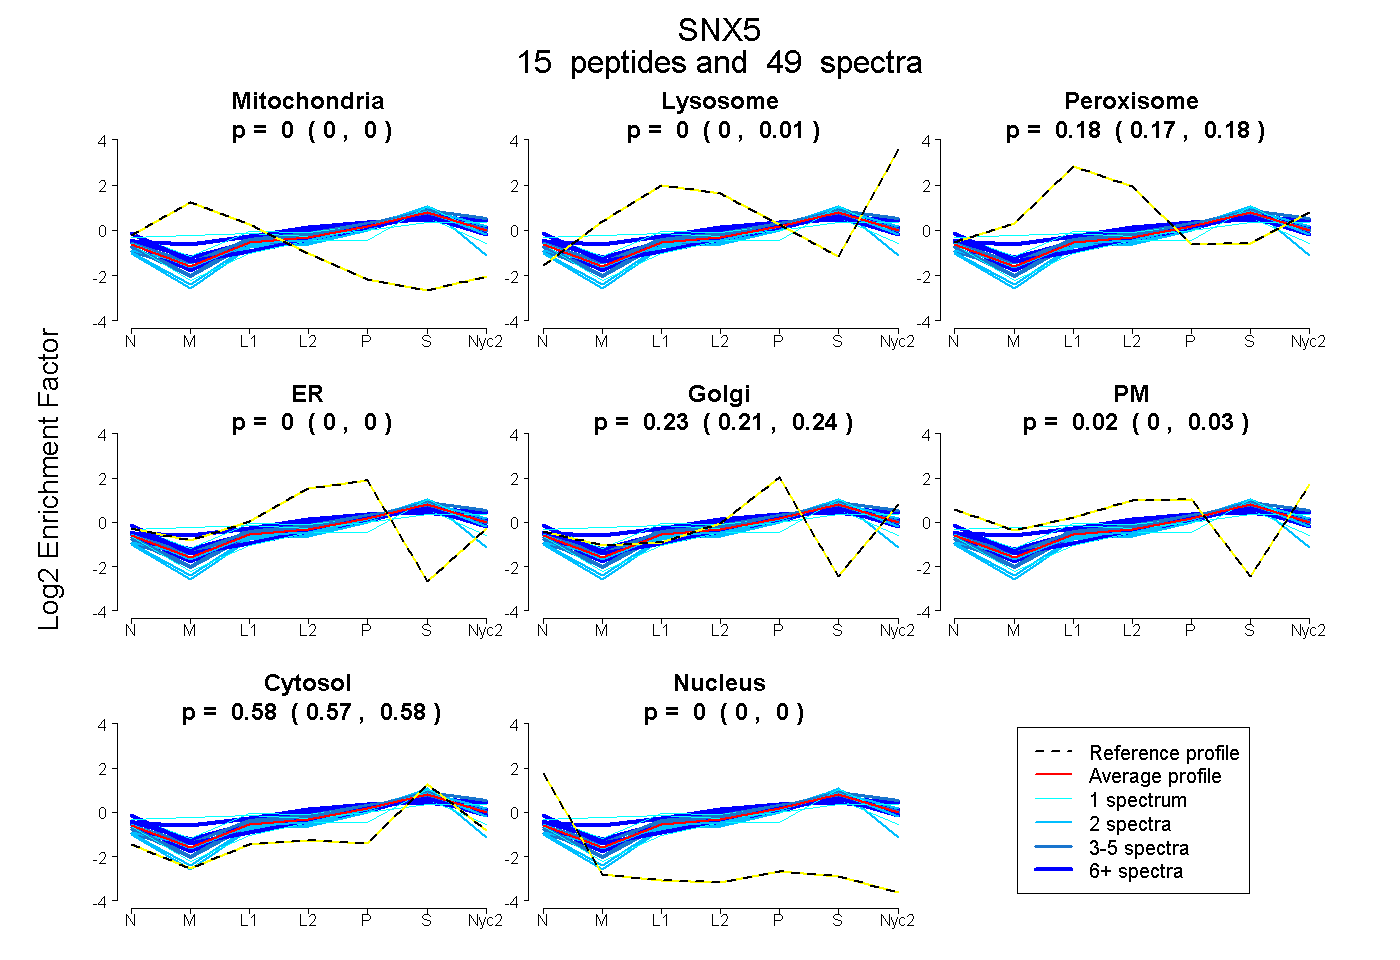
| Plot | Mito | Lyso | Perox | ER | Golgi | PM | Cytosol | Nucleus | |||||
| Expt A |
15 peptides |
49 spectra |
|
0.000 0.000 | 0.000 |
0.005 0.000 | 0.013 |
0.177 0.166 | 0.184 |
0.000 0.000 | 0.000 |
0.227 0.215 | 0.237 |
0.016 0.001 | 0.028 |
0.576 0.572 | 0.580 |
0.000 0.000 | 0.000 |
| 1 spectrum, SADEVLFSGVK | 0.000 | 0.000 | 0.226 | 0.220 | 0.024 | 0.004 | 0.525 | 0.000 | ||
| 2 spectra, LAETHQQECCQK | 0.000 | 0.000 | 0.013 | 0.209 | 0.000 | 0.000 | 0.779 | 0.000 | ||
| 1 spectrum, YYMLNIEAAK | 0.044 | 0.057 | 0.197 | 0.000 | 0.061 | 0.208 | 0.434 | 0.000 | ||
| 6 spectra, EVDDFFEQEK | 0.000 | 0.033 | 0.103 | 0.000 | 0.108 | 0.131 | 0.625 | 0.000 | ||
| 2 spectra, EELINFK | 0.000 | 0.076 | 0.000 | 0.037 | 0.162 | 0.000 | 0.726 | 0.000 | ||
| 1 spectrum, VAELFEK | 0.000 | 0.000 | 0.024 | 0.003 | 0.000 | 0.199 | 0.773 | 0.000 | ||
| 6 spectra, LGEGEGSMTK | 0.000 | 0.077 | 0.090 | 0.000 | 0.082 | 0.223 | 0.528 | 0.000 | ||
| 4 spectra, EMFGGFFK | 0.000 | 0.051 | 0.174 | 0.021 | 0.148 | 0.000 | 0.606 | 0.000 | ||
| 2 spectra, NFLINYYNR | 0.000 | 0.127 | 0.051 | 0.000 | 0.198 | 0.000 | 0.624 | 0.000 | ||
| 6 spectra, VAAFR | 0.000 | 0.000 | 0.000 | 0.056 | 0.016 | 0.307 | 0.622 | 0.000 | ||
| 2 spectra, VSSDEDLK | 0.000 | 0.000 | 0.159 | 0.000 | 0.236 | 0.000 | 0.605 | 0.000 | ||
| 3 spectra, NLIEMSELEIK | 0.000 | 0.000 | 0.224 | 0.000 | 0.252 | 0.000 | 0.524 | 0.000 | ||
| 3 spectra, ALIDYENSNK | 0.000 | 0.031 | 0.109 | 0.000 | 0.227 | 0.000 | 0.633 | 0.000 | ||
| 4 spectra, TTLPTFQSPEFSVTR | 0.000 | 0.174 | 0.013 | 0.000 | 0.111 | 0.087 | 0.614 | 0.000 | ||
| 6 spectra, LSSHPVLSK | 0.000 | 0.000 | 0.304 | 0.000 | 0.284 | 0.002 | 0.409 | 0.000 |
| Plot | Mito | Lyso or Perox | ER | Golgi | PM | Cytosol | Nucleus | ||||||
| Expt B |
4 peptides |
6 spectra |
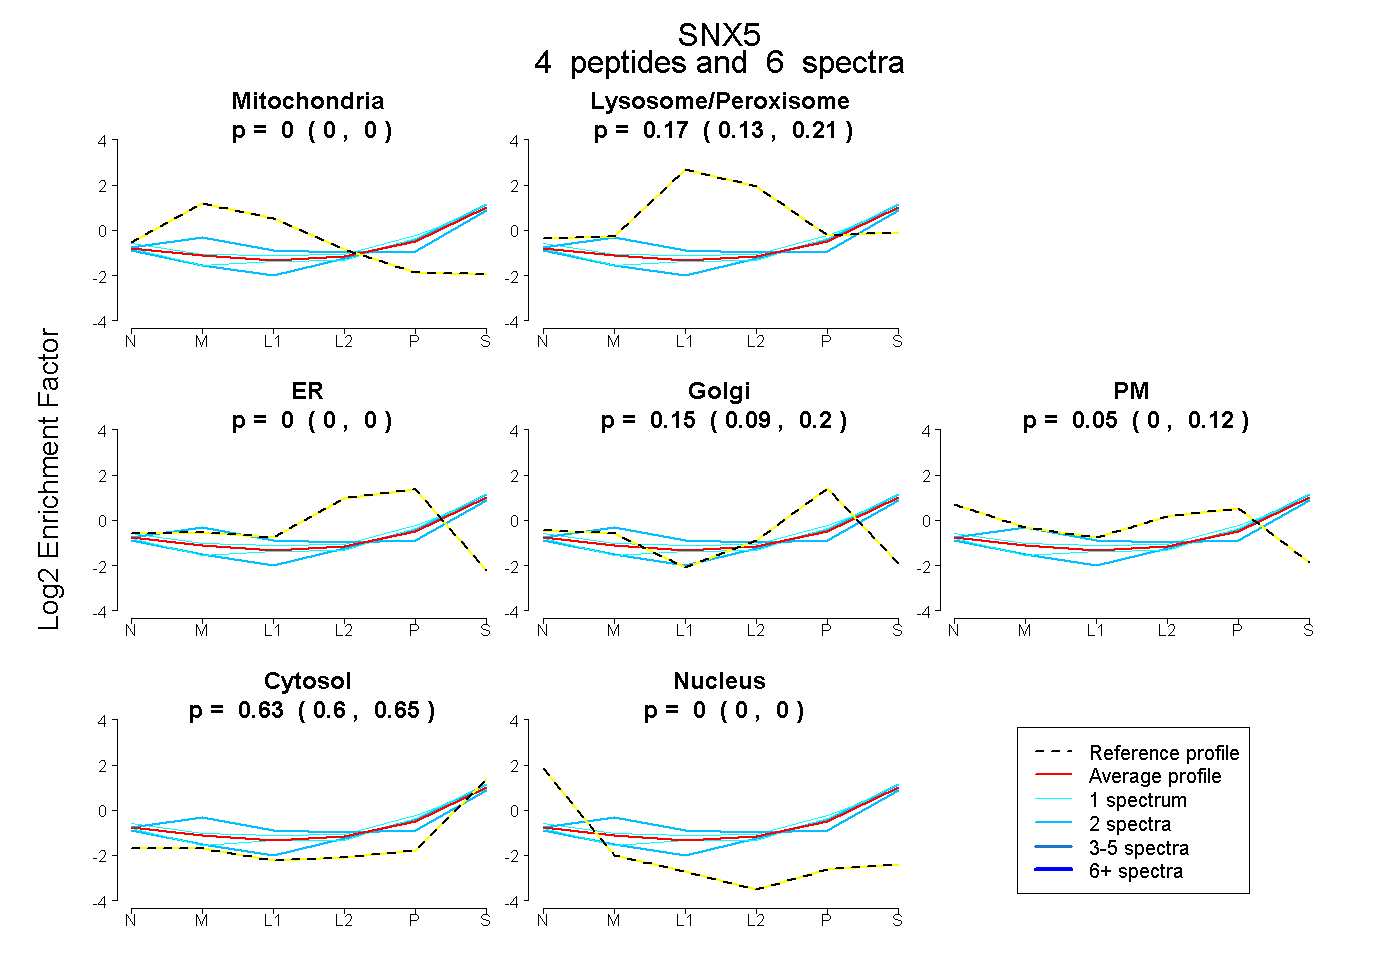 |
0.000 0.000 | 0.000 |
0.173 0.130 | 0.206 |
0.000 0.000 | 0.000 |
0.154 0.085 | 0.202 |
0.046 0.000 | 0.116 |
0.628 0.601 | 0.649 |
0.000 0.000 | 0.000 |
|||
| Plot | Lyso | Other | |||||||||||
| Expt C |
18 peptides |
85 spectra |
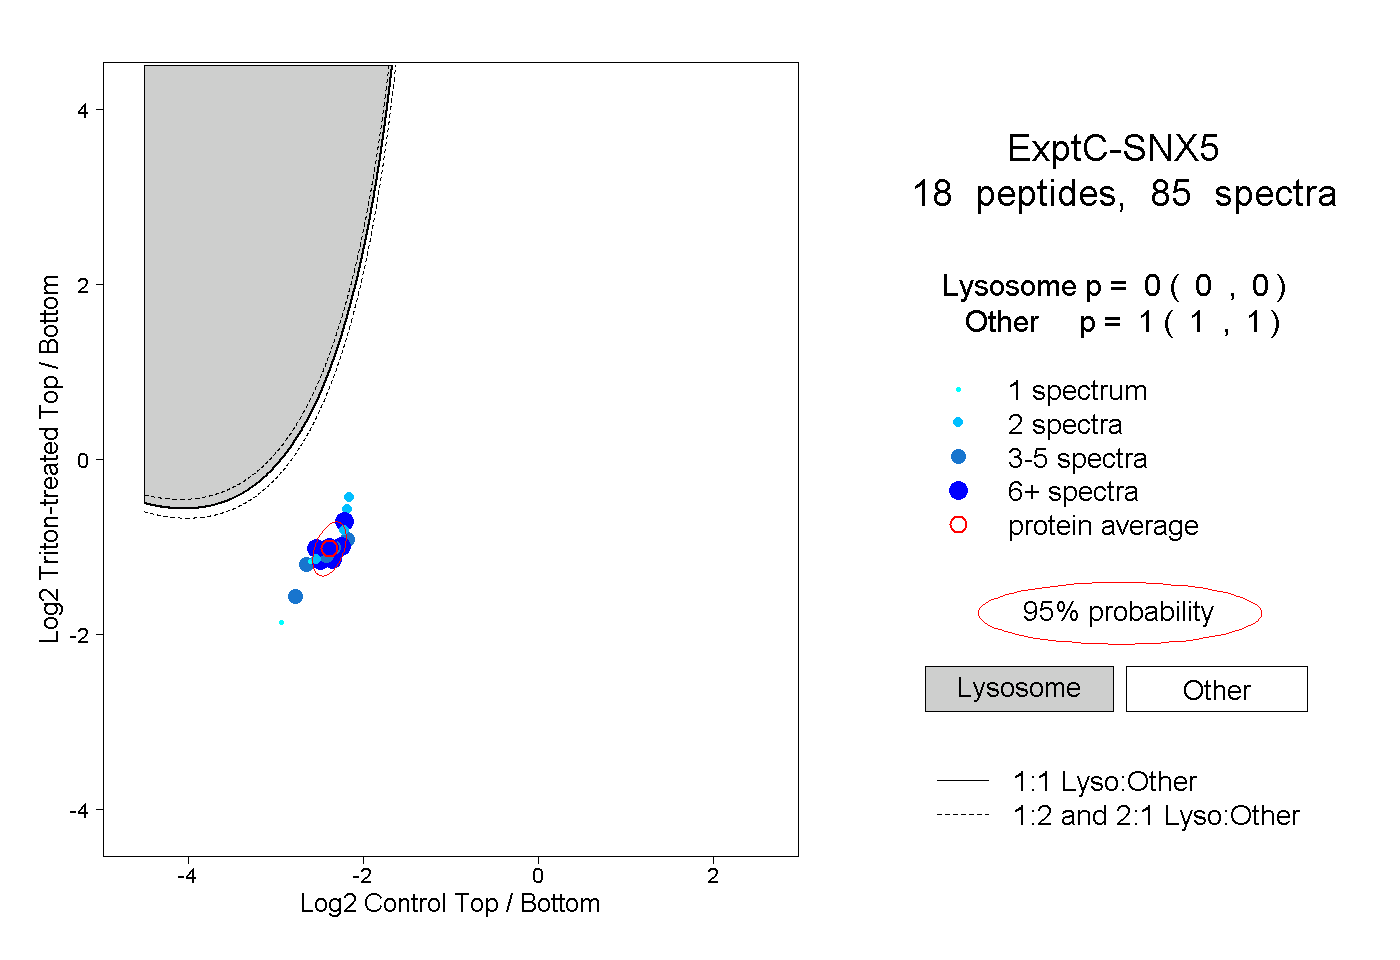 |
0.000 0.000 | 0.000 |
1.000 1.000 | 1.000 |
||||||||
| Plot | Lyso | Other | |||||||||||
| Expt D |
4 peptides |
13 spectra |
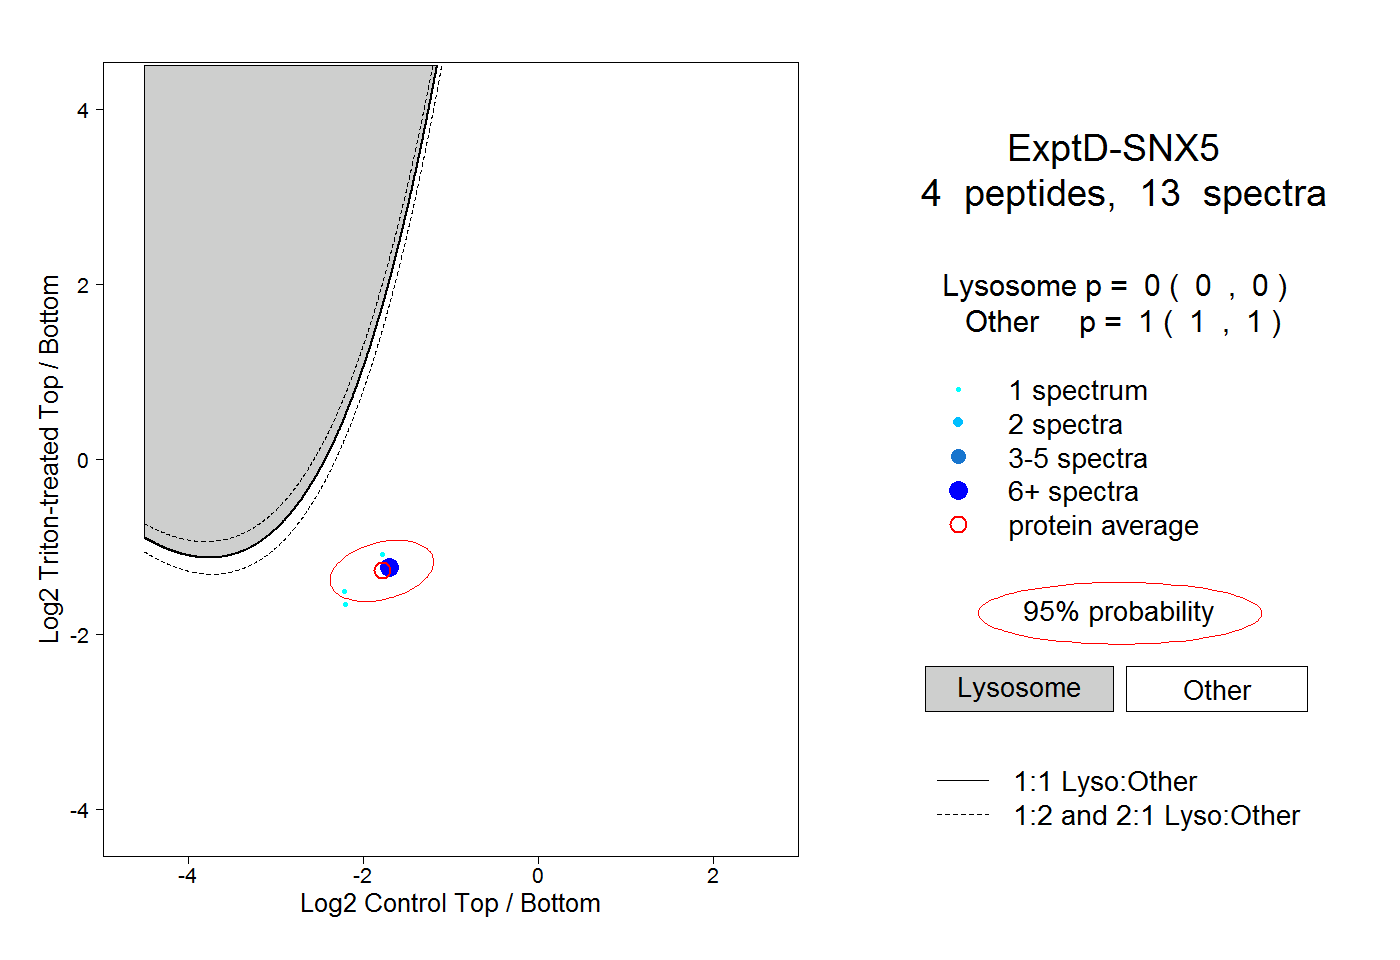 |
0.000 0.000 | 0.000 |
1.000 1.000 | 1.000 |