 10
10peptides
spectra
0.000 | 0.000
0.000 | 0.000
0.000 | 0.000
0.000 | 0.000
0.000 | 0.000
0.000 | 0.000
0.948 | 0.968
0.030 | 0.050
| Plot | Mito | Lyso | Perox | ER | Golgi | PM | Cytosol | Nucleus | |||||
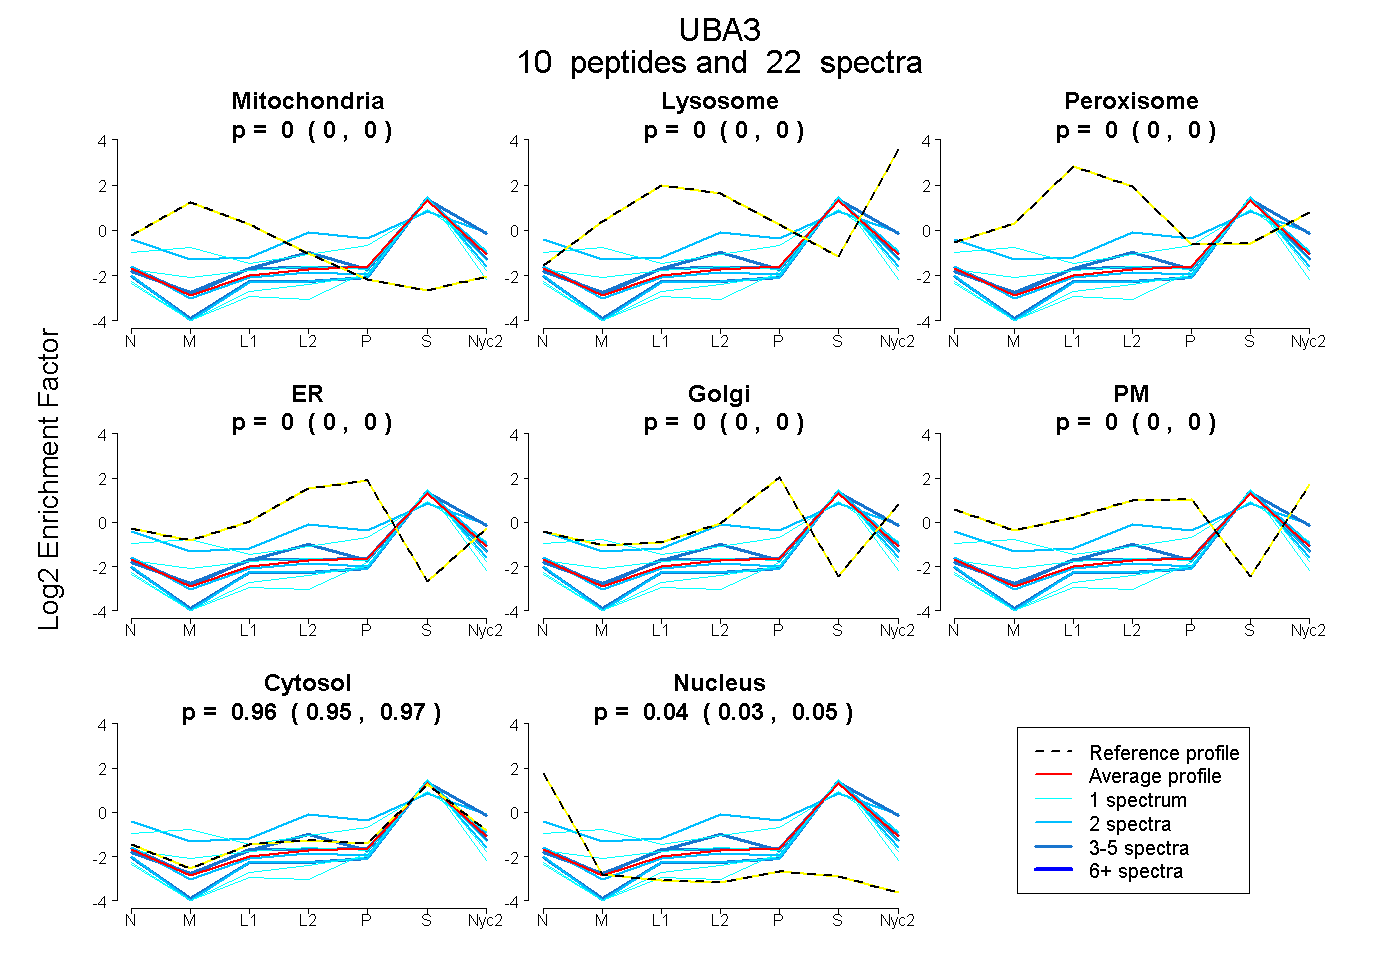
| Expt A |
10 peptides |
22 spectra |
|
0.000 0.000 | 0.000 |
0.000 0.000 | 0.000 |
0.000 0.000 | 0.000 |
0.000 0.000 | 0.000 |
0.000 0.000 | 0.000 |
0.000 0.000 | 0.000 |
0.959 0.948 | 0.968 |
0.041 0.030 | 0.050 |
| 4 spectra, QFLFRPK | 0.000 | 0.027 | 0.000 | 0.000 | 0.000 | 0.000 | 0.973 | 0.000 | ||
| 2 spectra, LPEHCIEYVR | 0.000 | 0.000 | 0.051 | 0.000 | 0.000 | 0.278 | 0.670 | 0.000 | ||
| 1 spectrum, VPNCNVVPHFNK | 0.161 | 0.012 | 0.003 | 0.000 | 0.108 | 0.000 | 0.716 | 0.000 | ||
| 2 spectra, SPAITATLEGK | 0.000 | 0.000 | 0.000 | 0.000 | 0.000 | 0.000 | 0.908 | 0.092 | ||
| 1 spectrum, WNHVK | 0.023 | 0.000 | 0.000 | 0.000 | 0.000 | 0.000 | 0.951 | 0.026 | ||
| 1 spectrum, MAVDGGCGDTGDWEGR | 0.000 | 0.000 | 0.000 | 0.000 | 0.000 | 0.000 | 0.847 | 0.153 | ||
| 4 spectra, AEVAAEFLNDR | 0.000 | 0.000 | 0.000 | 0.000 | 0.000 | 0.000 | 0.932 | 0.068 | ||
| 1 spectrum, TRPNLSK | 0.000 | 0.000 | 0.000 | 0.000 | 0.000 | 0.000 | 0.896 | 0.104 | ||
| 2 spectra, TLYLQSVTSIEER | 0.000 | 0.000 | 0.000 | 0.000 | 0.000 | 0.000 | 0.950 | 0.050 | ||
| 4 spectra, IQDFNDTFYR | 0.000 | 0.000 | 0.000 | 0.000 | 0.000 | 0.000 | 0.979 | 0.021 |
| Plot | Mito | Lyso or Perox | ER | Golgi | PM | Cytosol | Nucleus | ||||||
| Expt B |
1 peptide |
1 spectrum |
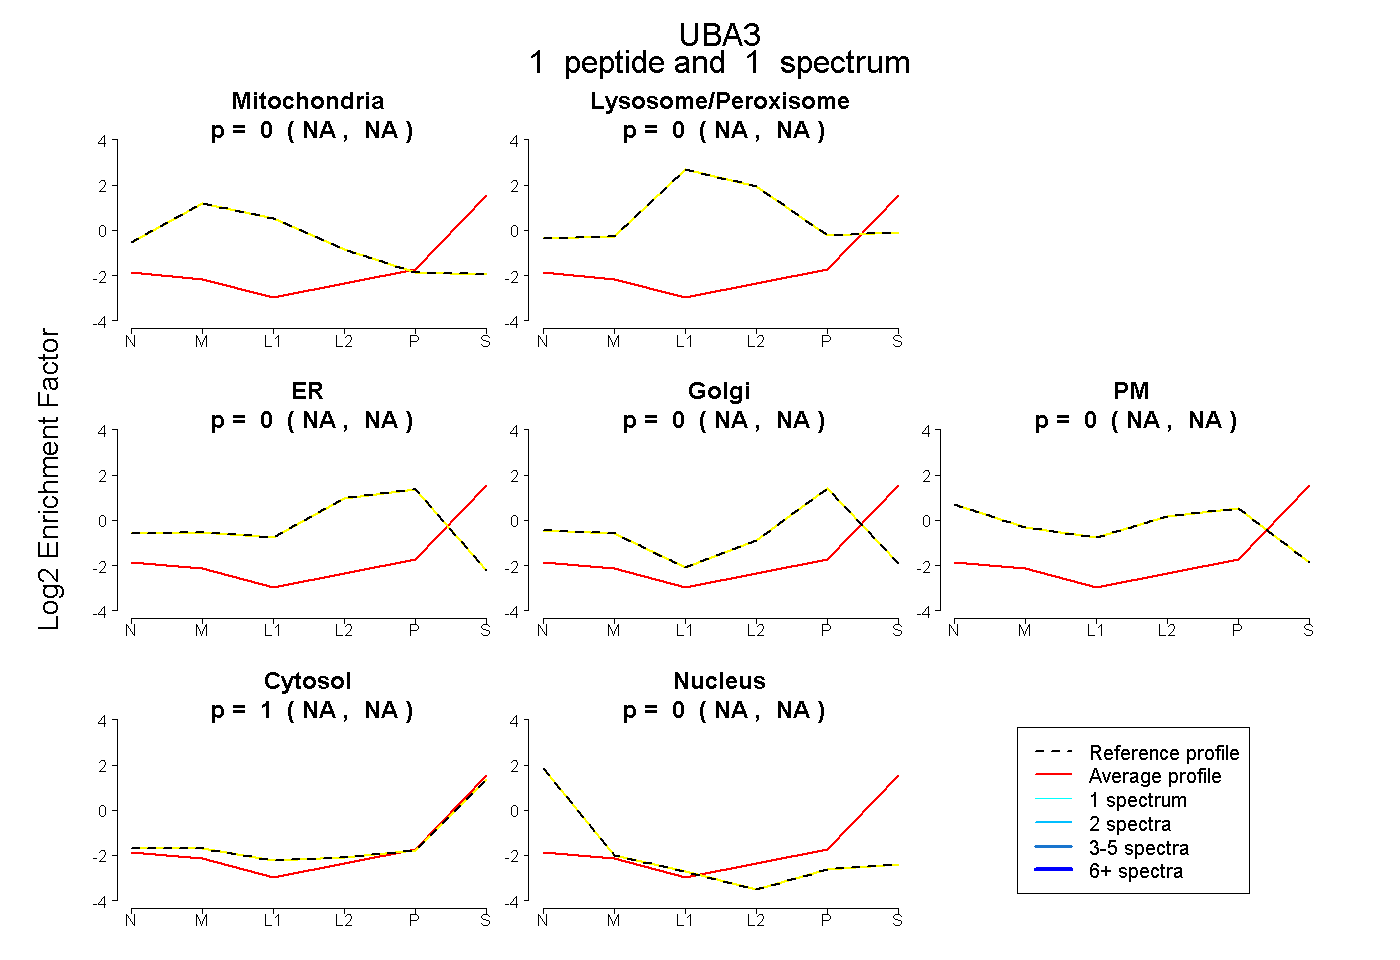 |
0.000 NA | NA |
0.000 NA | NA |
0.000 NA | NA |
0.000 NA | NA |
0.000 NA | NA |
1.000 NA | NA |
0.000 NA | NA |
|||
| Plot | Lyso | Other | |||||||||||
| Expt C |
3 peptides |
7 spectra |
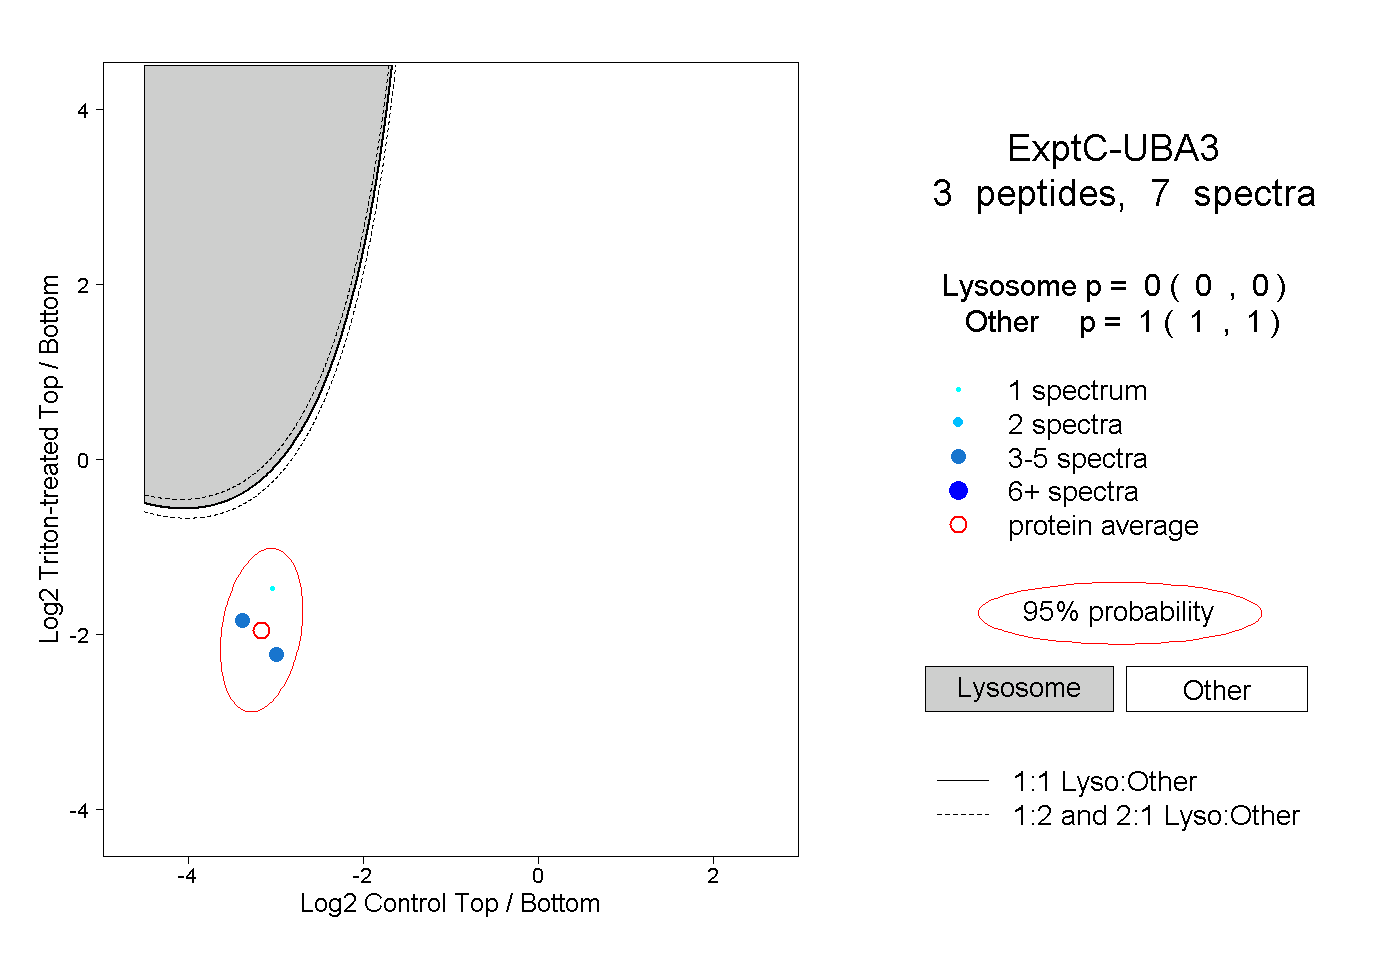 |
0.000 0.000 | 0.000 |
1.000 1.000 | 1.000 |
||||||||
| Plot | Lyso | Other | |||||||||||
| Expt D |
1 peptide |
1 spectrum |
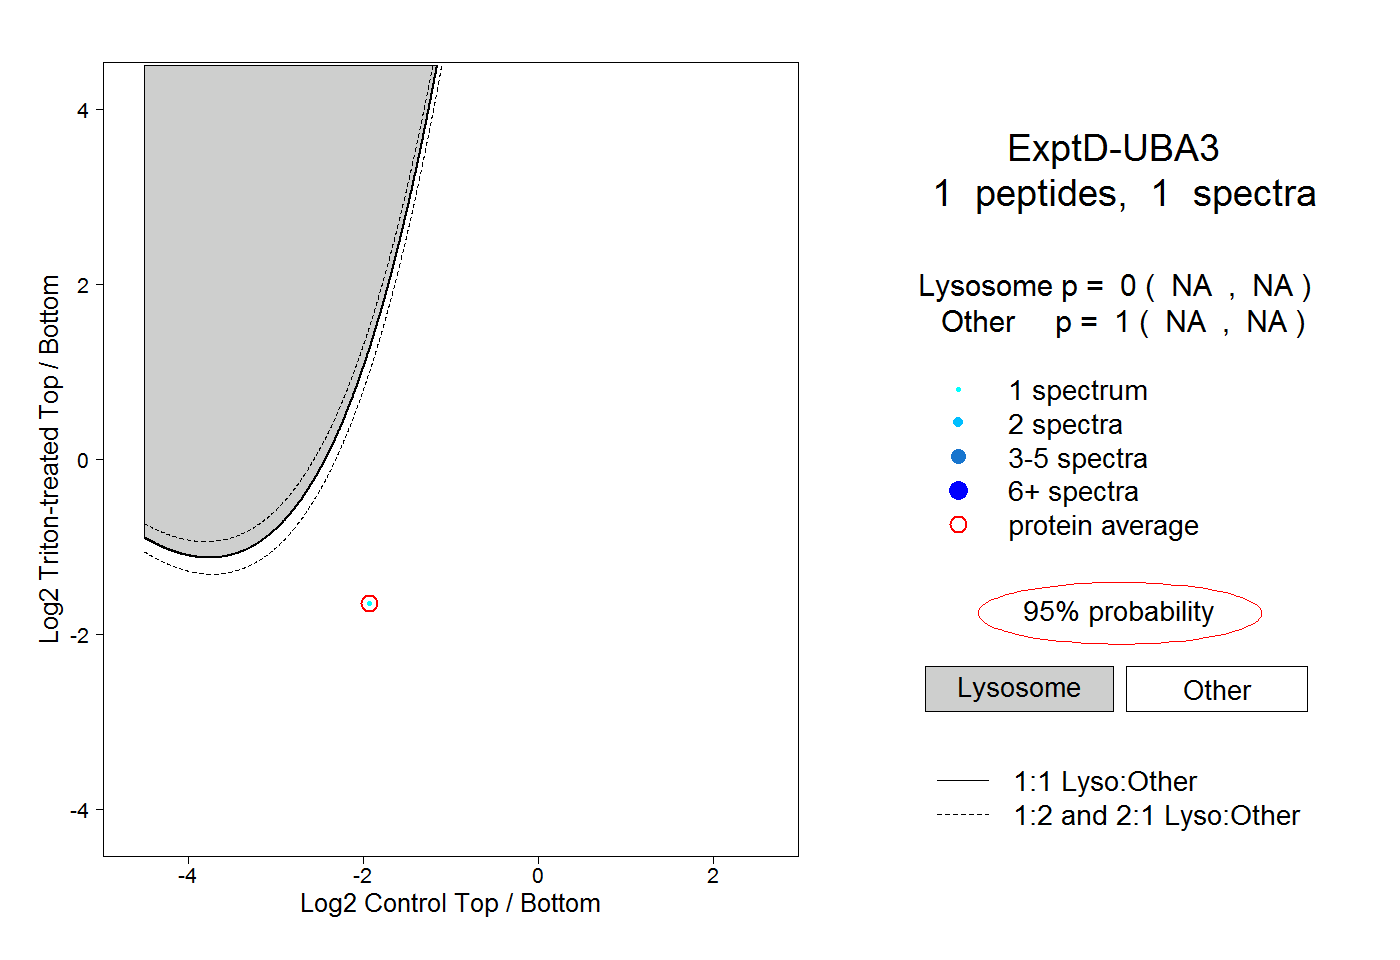 |
0.000 NA | NA |
1.000 NA | NA |