 9
9peptides
spectra
0.000 | 0.000
0.000 | 0.000
0.000 | 0.000
0.000 | 0.000
0.000 | 0.000
0.000 | 0.000
0.956 | 0.978
0.019 | 0.041
| Plot | Mito | Lyso | Perox | ER | Golgi | PM | Cytosol | Nucleus | |||||
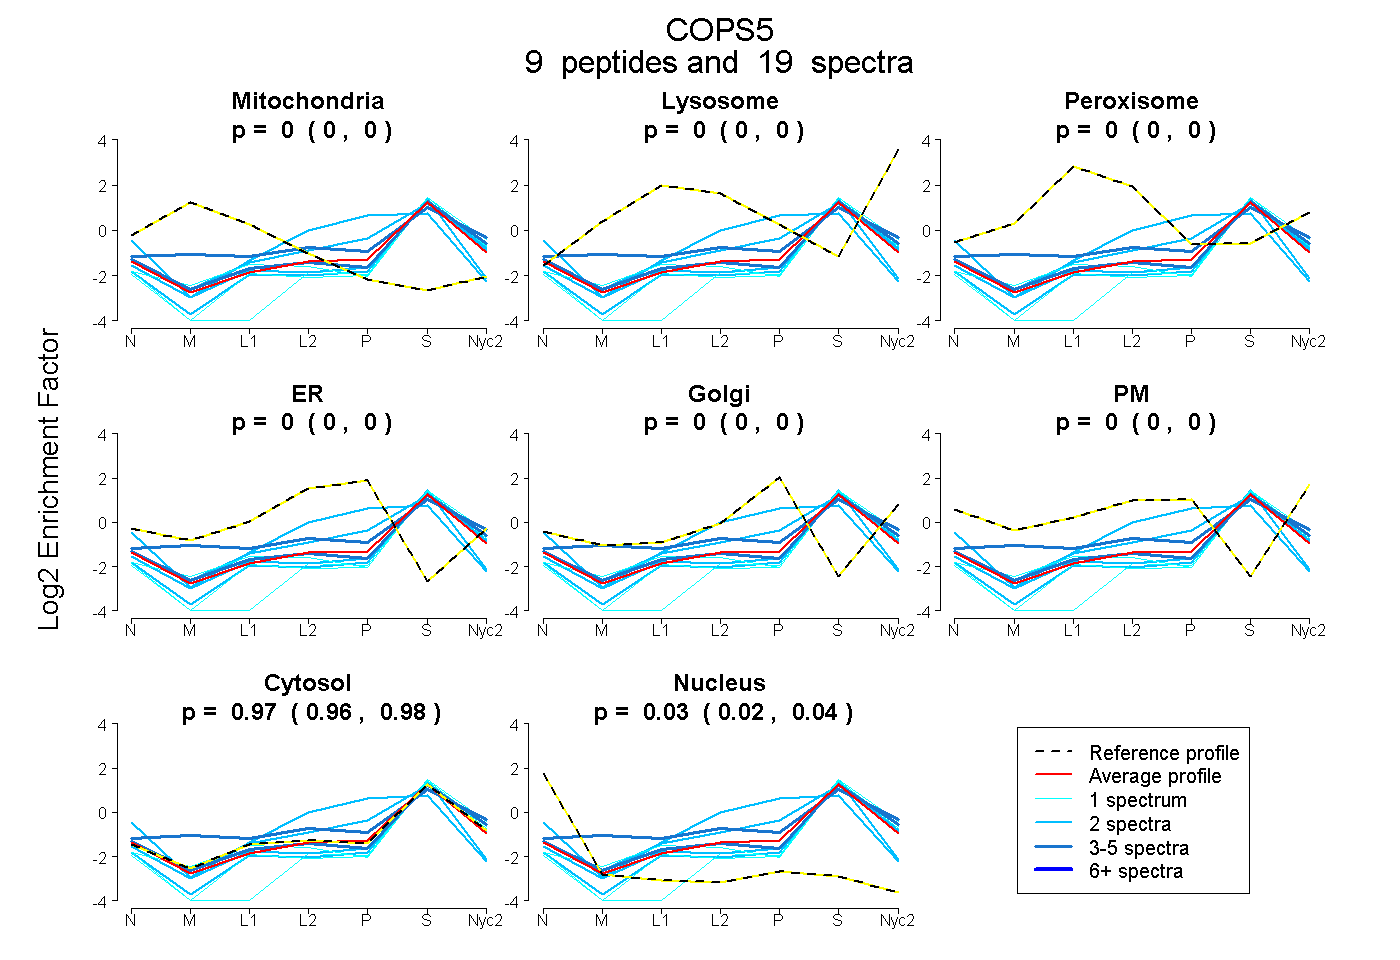
| Expt A |
9 peptides |
19 spectra |
|
0.000 0.000 | 0.000 |
0.000 0.000 | 0.000 |
0.000 0.000 | 0.000 |
0.000 0.000 | 0.000 |
0.000 0.000 | 0.000 |
0.000 0.000 | 0.000 |
0.969 0.956 | 0.978 |
0.031 0.019 | 0.041 |
| 2 spectra, IEDFGVHCK | 0.000 | 0.000 | 0.000 | 0.000 | 0.000 | 0.000 | 0.889 | 0.111 | ||
| 1 spectrum, LLELLWNK | 0.000 | 0.000 | 0.000 | 0.000 | 0.000 | 0.000 | 0.930 | 0.070 | ||
| 2 spectra, QYYALEVSYFK | 0.000 | 0.000 | 0.000 | 0.000 | 0.000 | 0.000 | 0.969 | 0.031 | ||
| 1 spectrum, TTIEAIHGLMSQVIK | 0.000 | 0.000 | 0.000 | 0.000 | 0.000 | 0.000 | 1.000 | 0.000 | ||
| 4 spectra, VNLGAFR | 0.000 | 0.000 | 0.000 | 0.000 | 0.000 | 0.000 | 0.988 | 0.012 | ||
| 2 spectra, DHHYFK | 0.000 | 0.000 | 0.000 | 0.284 | 0.000 | 0.000 | 0.661 | 0.055 | ||
| 1 spectrum, ISALALLK | 0.000 | 0.000 | 0.000 | 0.000 | 0.000 | 0.000 | 0.990 | 0.010 | ||
| 4 spectra, MVMHAR | 0.089 | 0.146 | 0.000 | 0.000 | 0.012 | 0.000 | 0.752 | 0.000 | ||
| 2 spectra, LEQSEAQLGR | 0.000 | 0.000 | 0.000 | 0.085 | 0.034 | 0.000 | 0.881 | 0.000 |
| Plot | Mito | Lyso or Perox | ER | Golgi | PM | Cytosol | Nucleus | ||||||
| Expt B |
2 peptides |
4 spectra |
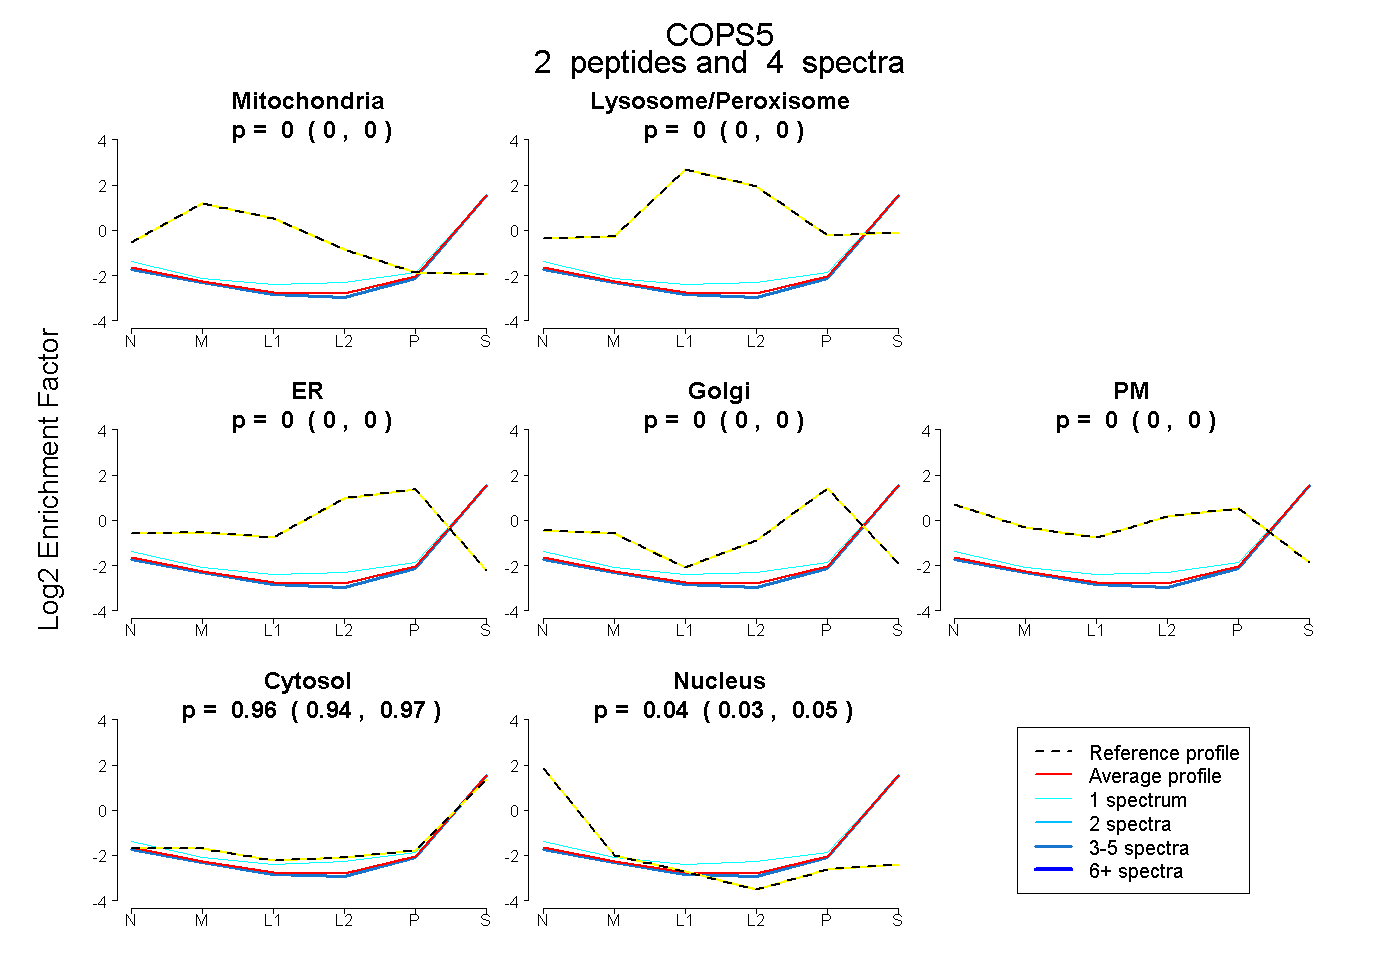 |
0.000 0.000 | 0.000 |
0.000 0.000 | 0.000 |
0.000 0.000 | 0.000 |
0.000 0.000 | 0.000 |
0.000 0.000 | 0.000 |
0.958 0.944 | 0.971 |
0.042 0.027 | 0.053 |
|||
| Plot | Lyso | Other | |||||||||||
| Expt C |
5 peptides |
9 spectra |
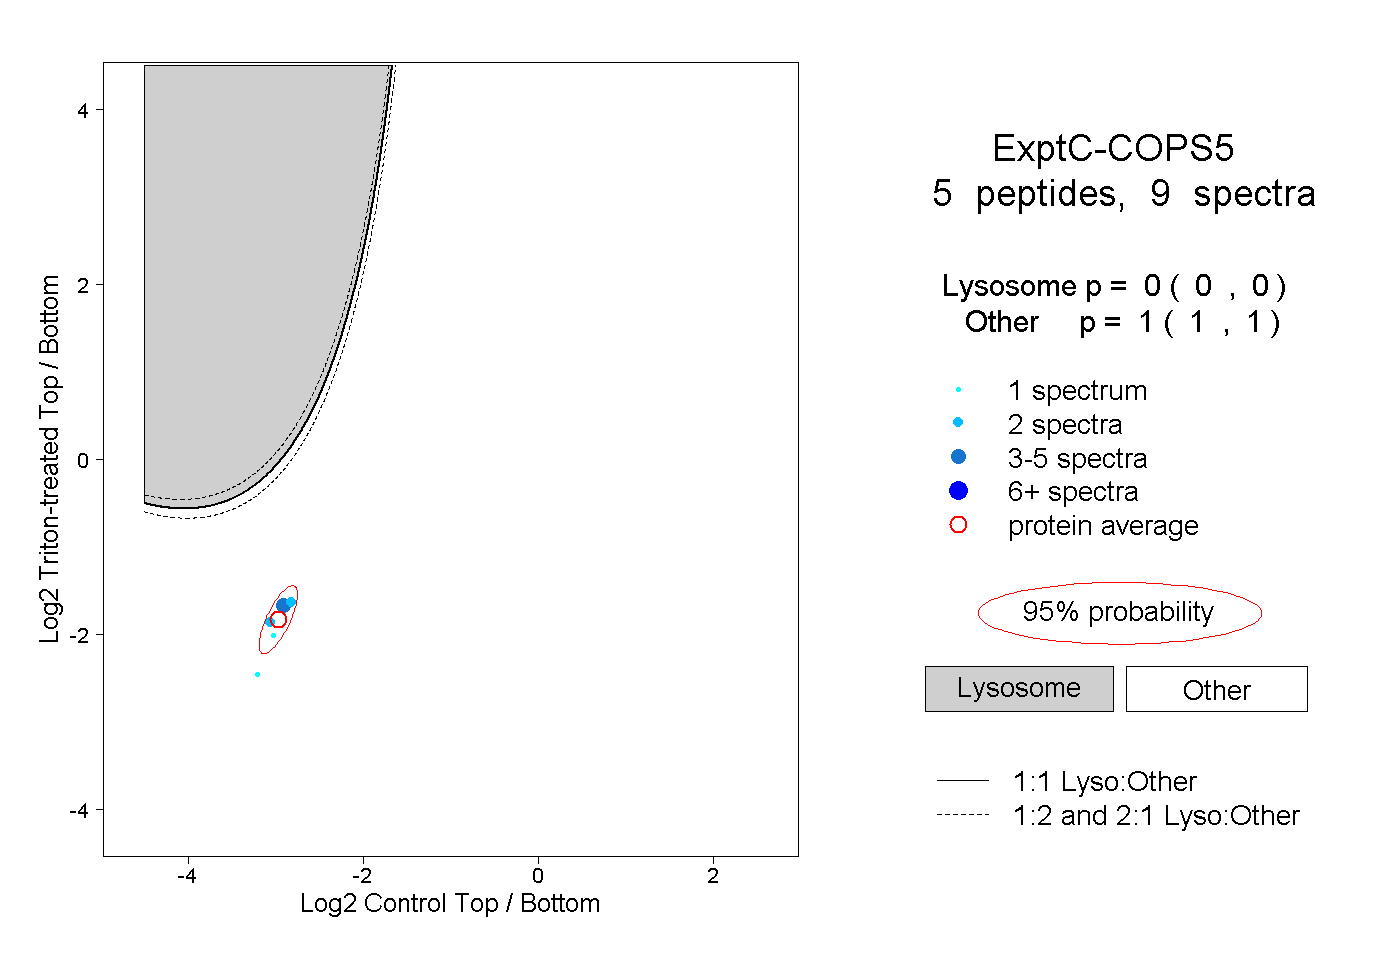 |
0.000 0.000 | 0.000 |
1.000 1.000 | 1.000 |
||||||||
| Plot | Lyso | Other | |||||||||||
| Expt D |
1 peptide |
1 spectrum |
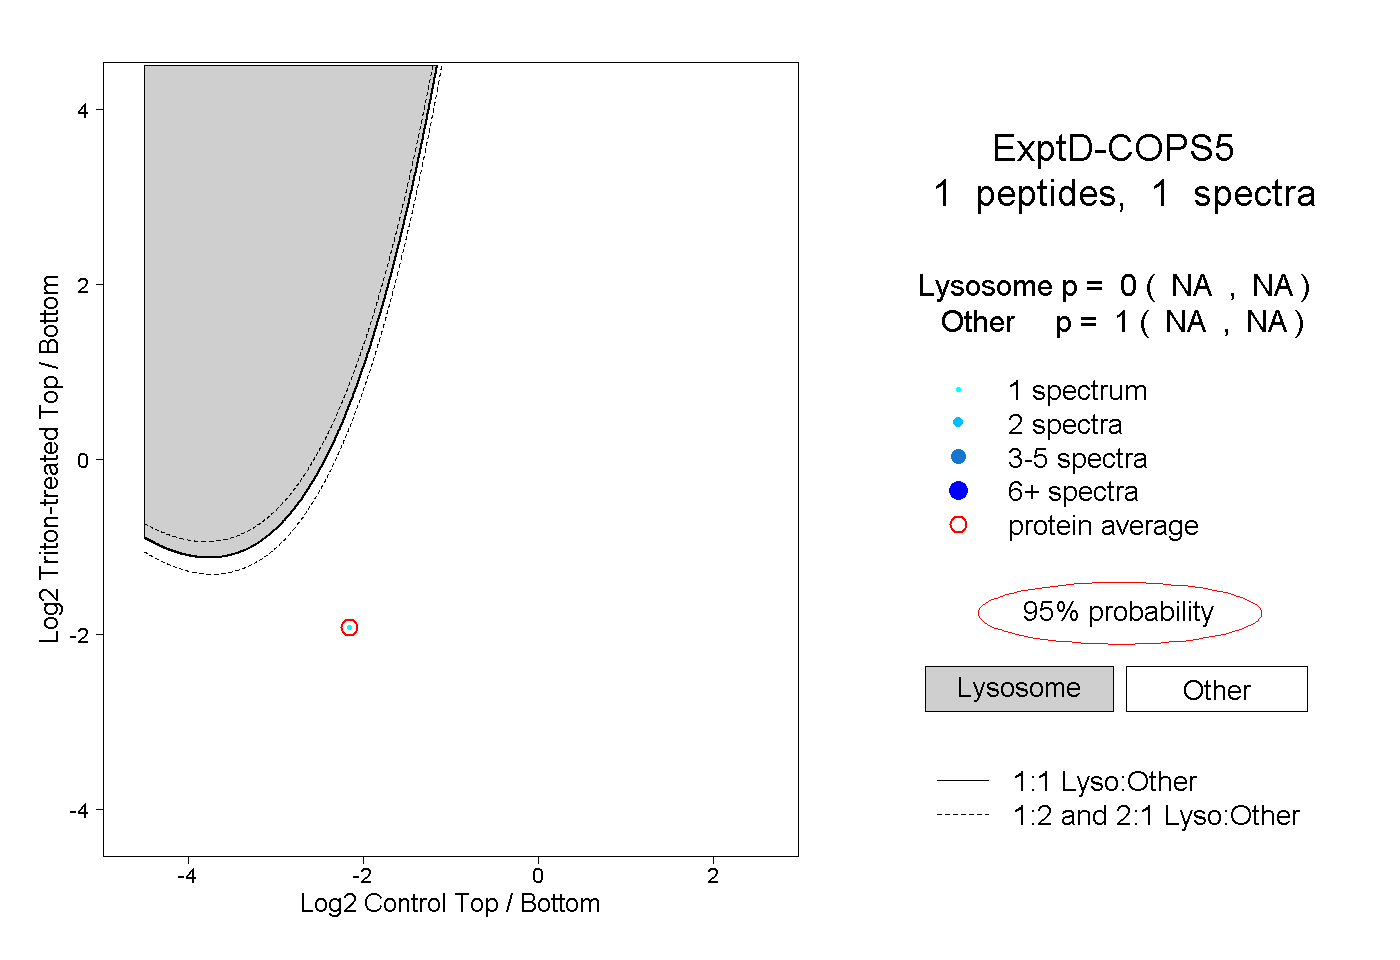 |
0.000 NA | NA |
1.000 NA | NA |