10
10peptides
spectra
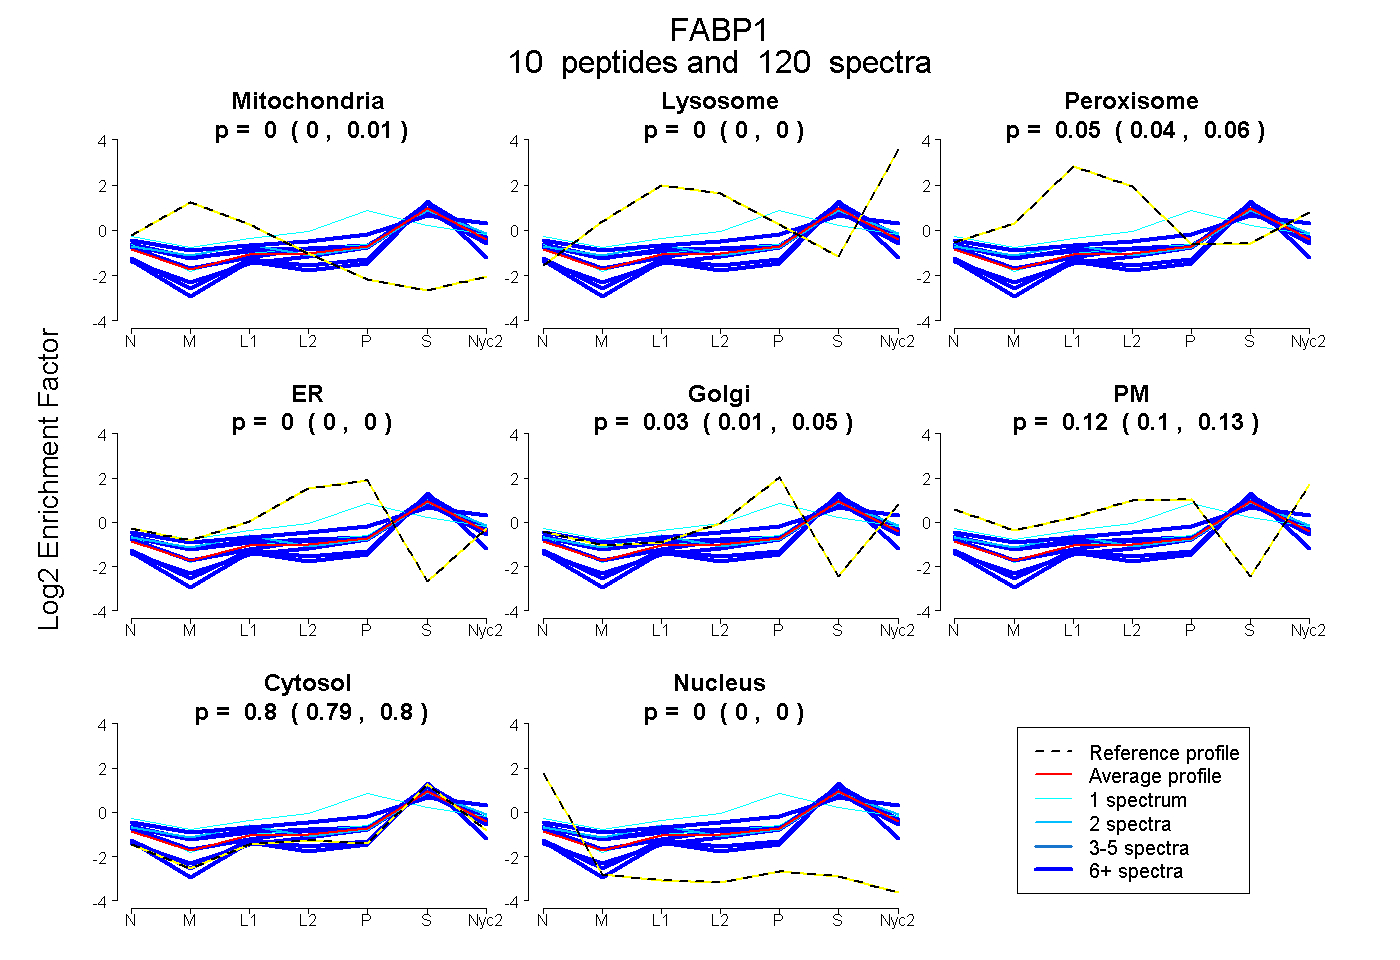
0.000 | 0.008
0.000 | 0.000
0.041 | 0.056
0.000 | 0.000
0.014 | 0.047
0.099 | 0.134
0.790 | 0.803
0.000 | 0.000
5peptides
spectra
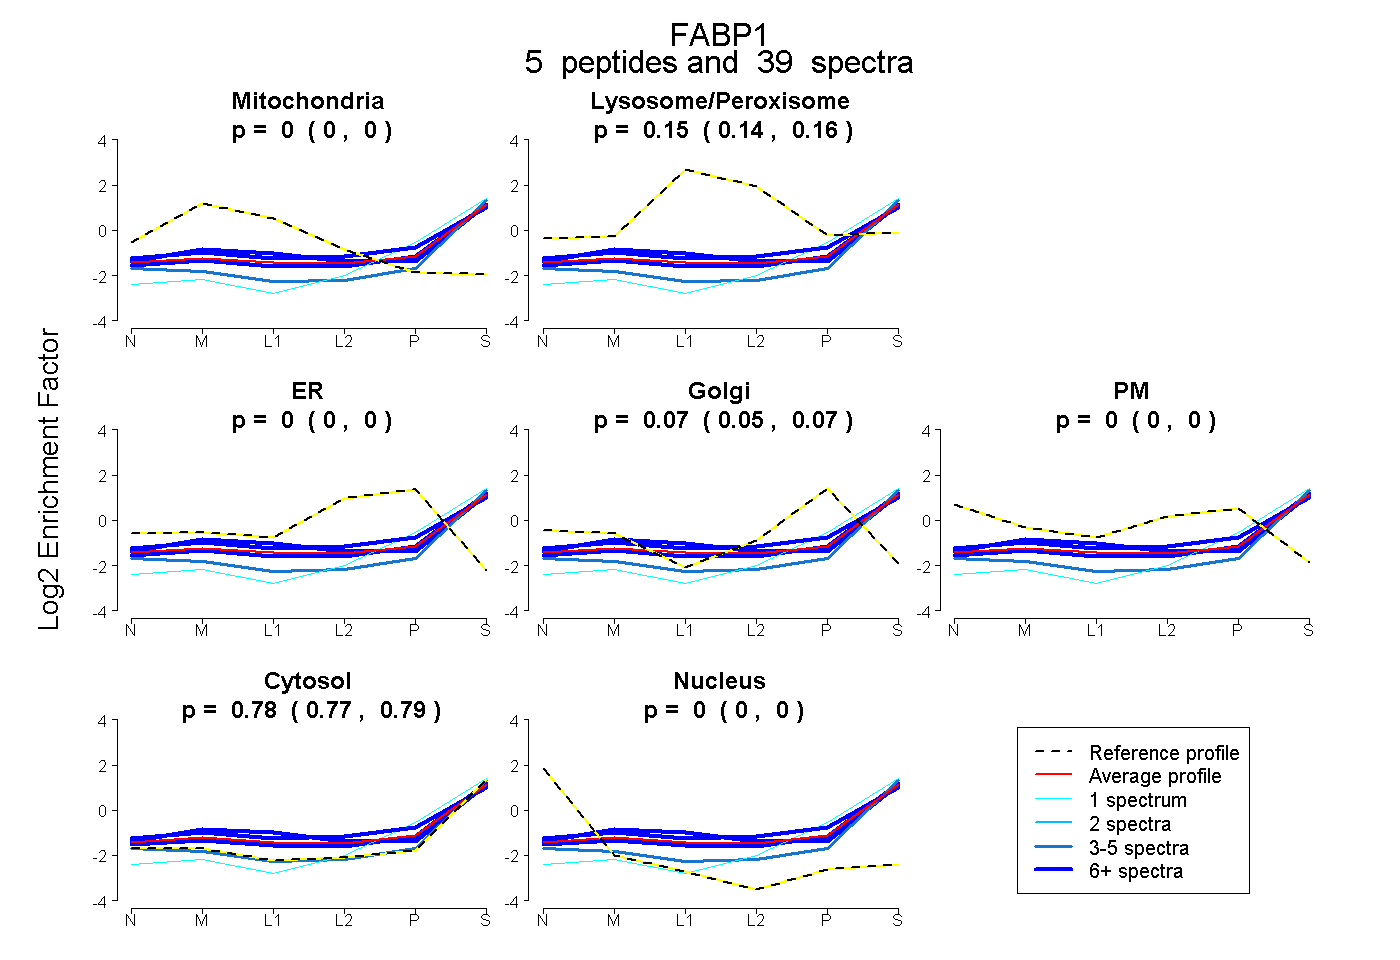
0.000 | 0.000
0.141 | 0.162
0.000 | 0.000
0.054 | 0.075
0.000 | 0.000
0.773 | 0.791
0.000 | 0.000