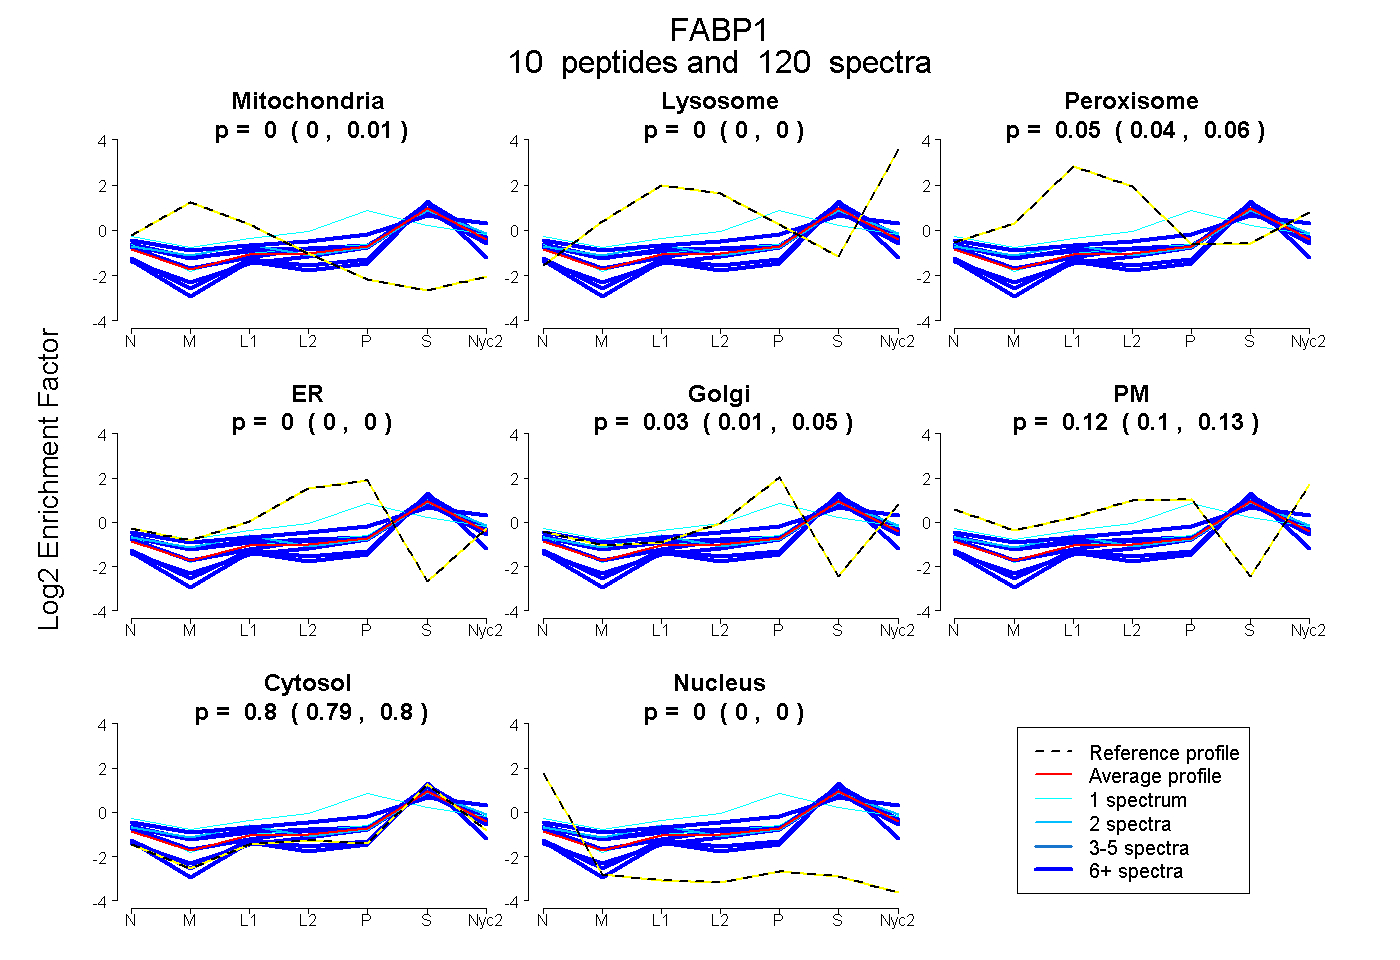
 10
10peptides
spectra
0.000 | 0.008
0.000 | 0.000
0.041 | 0.056
0.000 | 0.000
0.014 | 0.047
0.099 | 0.134
0.790 | 0.803
0.000 | 0.000
| Plot | Mito | Lyso | Perox | ER | Golgi | PM | Cytosol | Nucleus | |||||
| Expt A |
10 peptides |
120 spectra |
|
0.002 0.000 | 0.008 |
0.000 0.000 | 0.000 |
0.049 0.041 | 0.056 |
0.000 0.000 | 0.000 |
0.033 0.014 | 0.047 |
0.118 0.099 | 0.134 |
0.797 0.790 | 0.803 |
0.000 0.000 | 0.000 |
| 2 spectra, SVTEFNGDTITNTMTLGDIVYK | 0.072 | 0.082 | 0.061 | 0.000 | 0.000 | 0.086 | 0.699 | 0.000 | ||
| 21 spectra, MEGDNK | 0.000 | 0.000 | 0.023 | 0.000 | 0.000 | 0.177 | 0.800 | 0.000 | ||
| 21 spectra, LTITYGSK | 0.000 | 0.000 | 0.000 | 0.000 | 0.000 | 0.000 | 0.951 | 0.049 | ||
| 1 spectrum, MADDNK | 0.000 | 0.005 | 0.030 | 0.000 | 0.000 | 0.192 | 0.773 | 0.000 | ||
| 11 spectra, YQVQSQENFEPFMK | 0.000 | 0.073 | 0.058 | 0.000 | 0.000 | 0.268 | 0.601 | 0.000 | ||
| 6 spectra, MNFSGK | 0.000 | 0.009 | 0.000 | 0.000 | 0.096 | 0.000 | 0.895 | 0.000 | ||
| 17 spectra, AMGLPEDLIQK | 0.059 | 0.000 | 0.096 | 0.000 | 0.006 | 0.122 | 0.717 | 0.000 | ||
| 1 spectrum, NFSGK | 0.000 | 0.000 | 0.202 | 0.081 | 0.334 | 0.000 | 0.383 | 0.000 | ||
| 24 spectra, MVTTFK | 0.000 | 0.039 | 0.000 | 0.000 | 0.000 | 0.000 | 0.960 | 0.001 | ||
| 16 spectra, GVSEIVHEGK | 0.070 | 0.000 | 0.082 | 0.000 | 0.022 | 0.122 | 0.705 | 0.000 |
| Plot | Mito | Lyso or Perox | ER | Golgi | PM | Cytosol | Nucleus | ||||||
| Expt B |
5 peptides |
39 spectra |
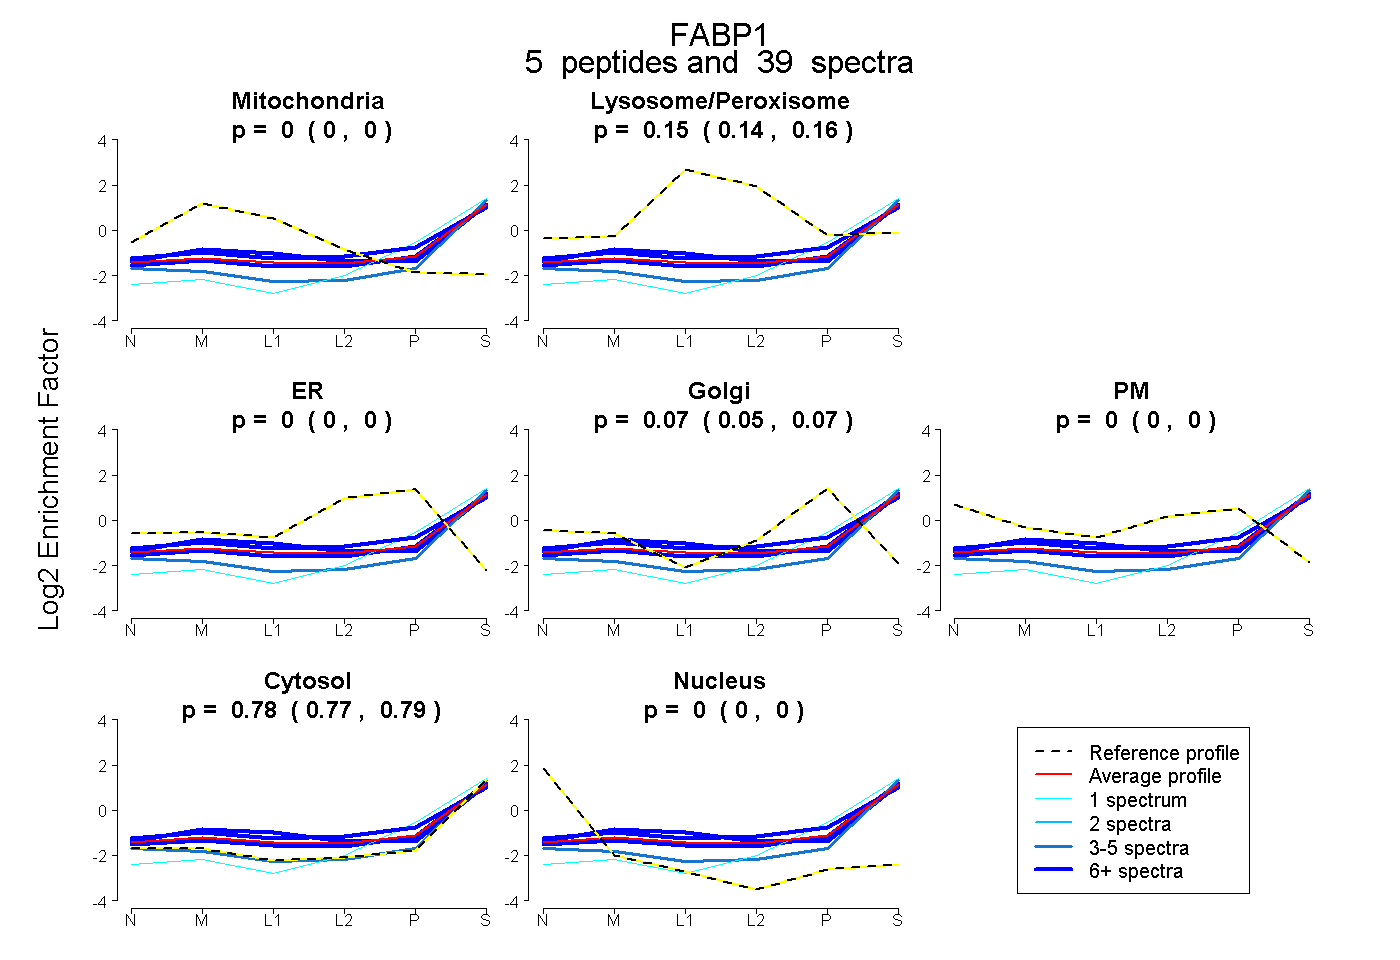 |
0.000 0.000 | 0.000 |
0.152 0.141 | 0.162 |
0.000 0.000 | 0.000 |
0.065 0.054 | 0.075 |
0.000 0.000 | 0.000 |
0.783 0.773 | 0.791 |
0.000 0.000 | 0.000 |
|||
| Plot | Lyso | Other | |||||||||||
| Expt C |
9 peptides |
470 spectra |
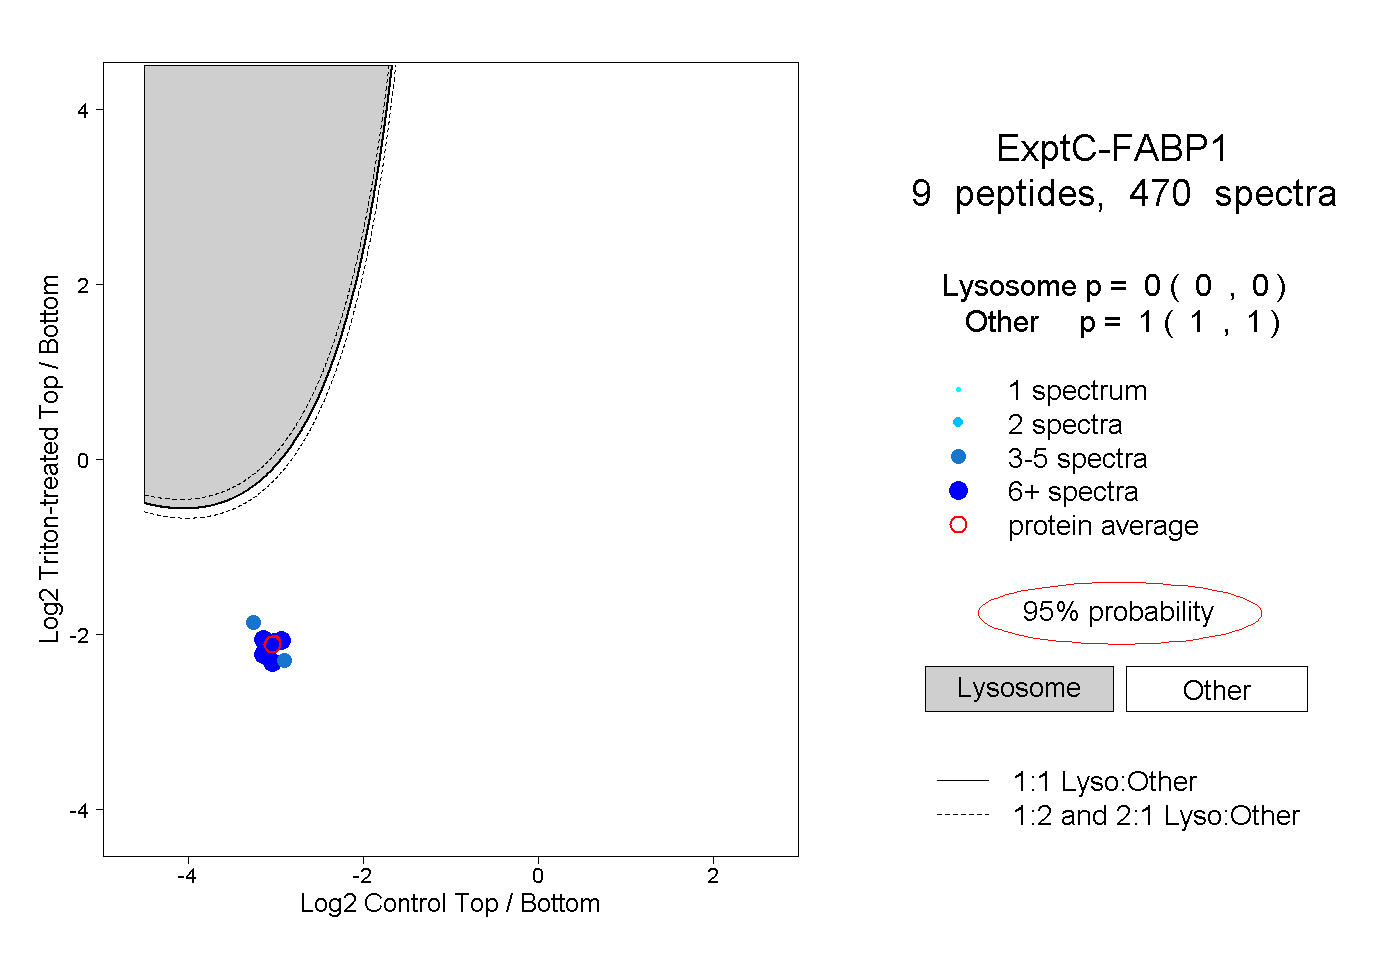 |
0.000 0.000 | 0.000 |
1.000 1.000 | 1.000 |
||||||||
| Plot | Lyso | Other | |||||||||||
| Expt D |
4 peptides |
18 spectra |
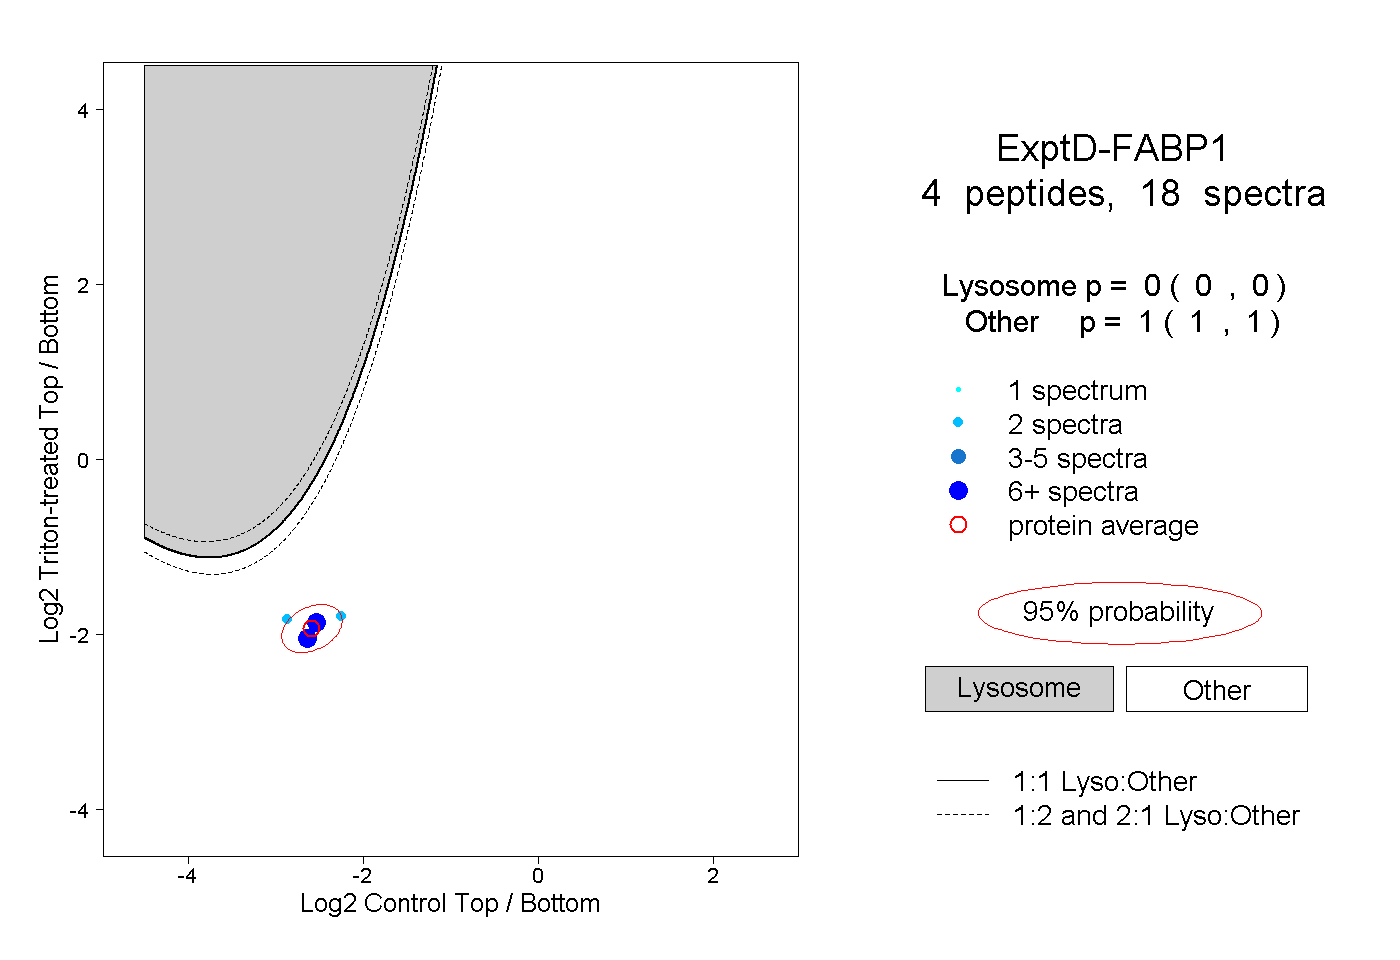 |
0.000 0.000 | 0.000 |
1.000 1.000 | 1.000 |