 2
2peptides
spectra
0.118 | 0.372
0.000 | 0.000
0.000 | 0.139
0.028 | 0.265
0.000 | 0.000
0.000 | 0.000
0.458 | 0.580
0.000 | 0.069
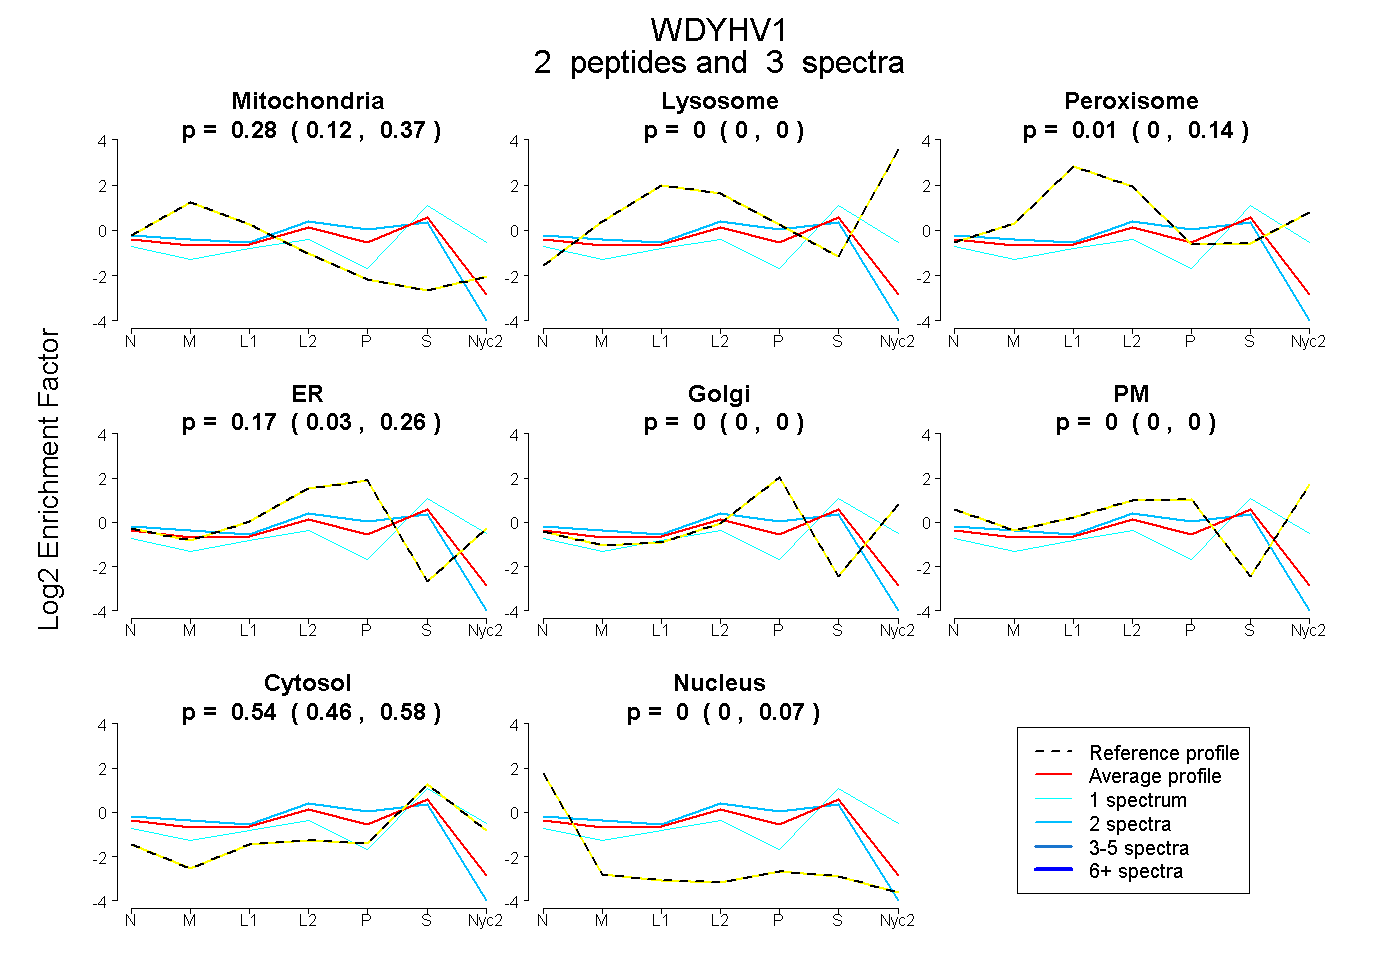
| Plot | Mito | Lyso | Perox | ER | Golgi | PM | Cytosol | Nucleus | |||||
| Expt A |
2 peptides |
3 spectra |
|
0.280 0.118 | 0.372 |
0.000 0.000 | 0.000 |
0.008 0.000 | 0.139 |
0.174 0.028 | 0.265 |
0.000 0.000 | 0.000 |
0.000 0.000 | 0.000 |
0.537 0.458 | 0.580 |
0.000 0.000 | 0.069 |
| 1 spectrum, SDDDIHPQFR | 0.074 | 0.000 | 0.194 | 0.000 | 0.000 | 0.000 | 0.733 | 0.000 | ||
| 2 spectra, AATASQYQPACPTR | 0.309 | 0.000 | 0.000 | 0.250 | 0.000 | 0.000 | 0.397 | 0.044 |