 3
3peptides
spectra
0.000 | 0.000
0.086 | 0.142
0.000 | 0.000
0.000 | 0.000
0.718 | 0.764
0.000 | 0.000
0.124 | 0.157
0.000 | 0.000
2peptides
spectra
0.000 | 0.000
1.000 | 1.000
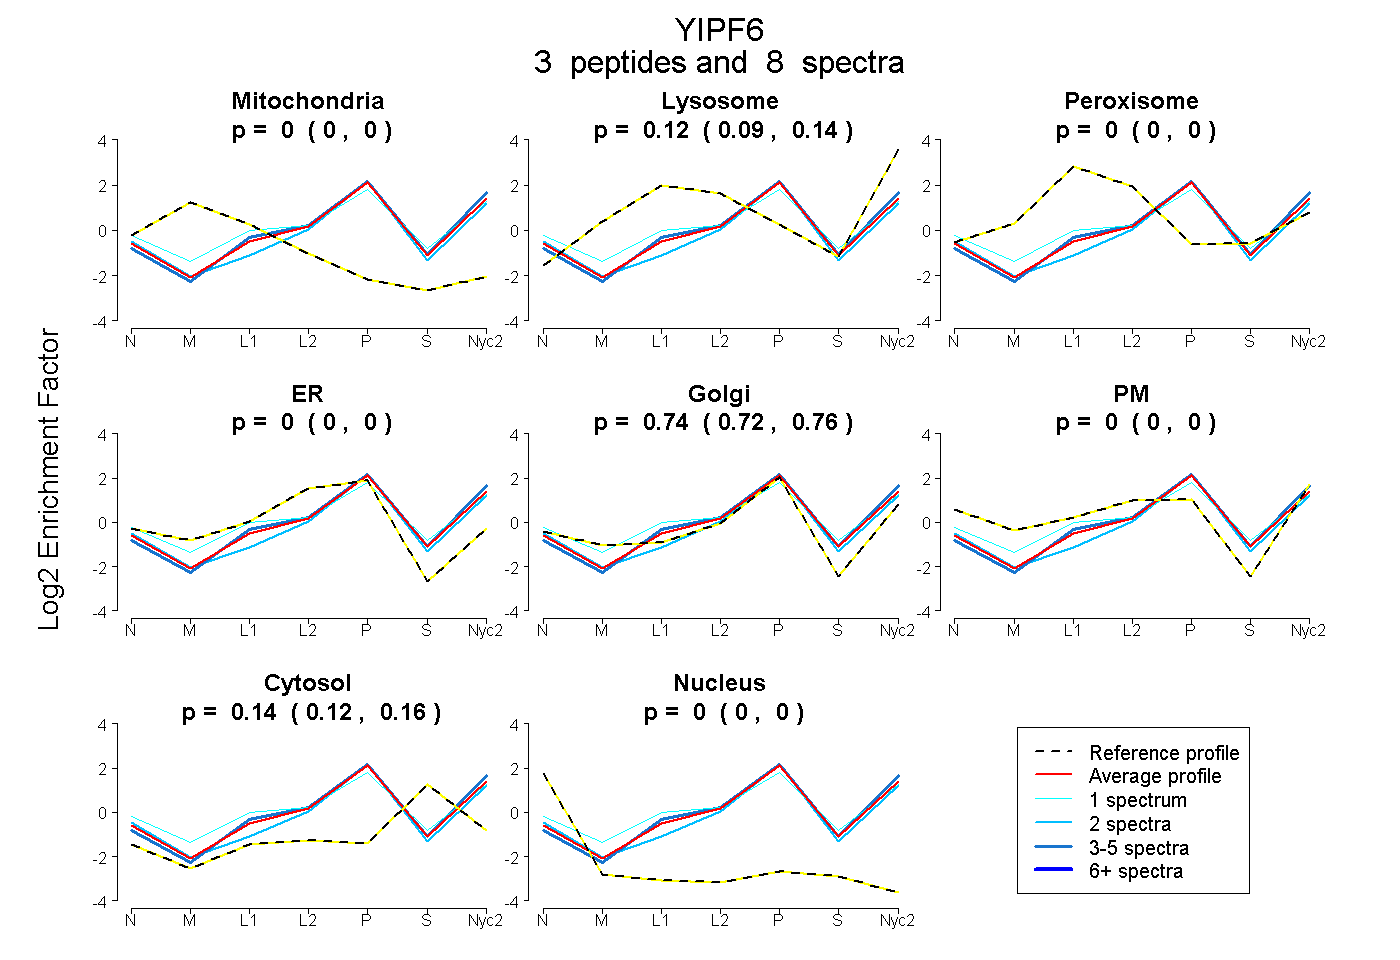
| Plot | Mito | Lyso | Perox | ER | Golgi | PM | Cytosol | Nucleus | |||||
| Expt A |
3 peptides |
8 spectra |
|
0.000 0.000 | 0.000 |
0.116 0.086 | 0.142 |
0.000 0.000 | 0.000 |
0.000 0.000 | 0.000 |
0.742 0.718 | 0.764 |
0.000 0.000 | 0.000 |
0.141 0.124 | 0.157 |
0.000 0.000 | 0.000 |
||
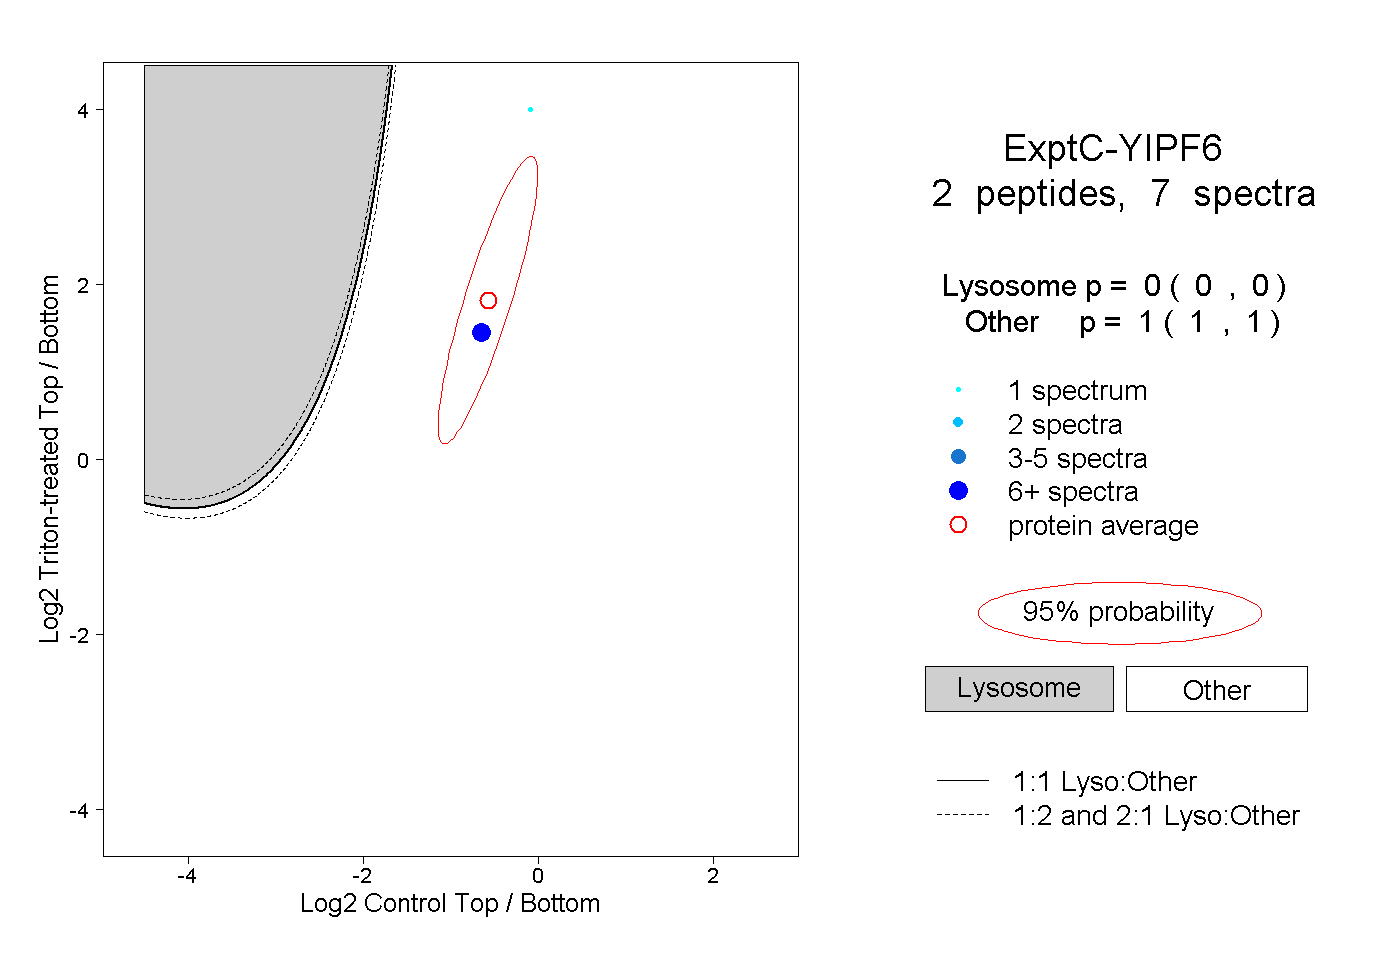
| Plot | Lyso | Other | |||||||||||
| Expt C |
2 peptides |
7 spectra |
|
0.000 0.000 | 0.000 |
1.000 1.000 | 1.000 |