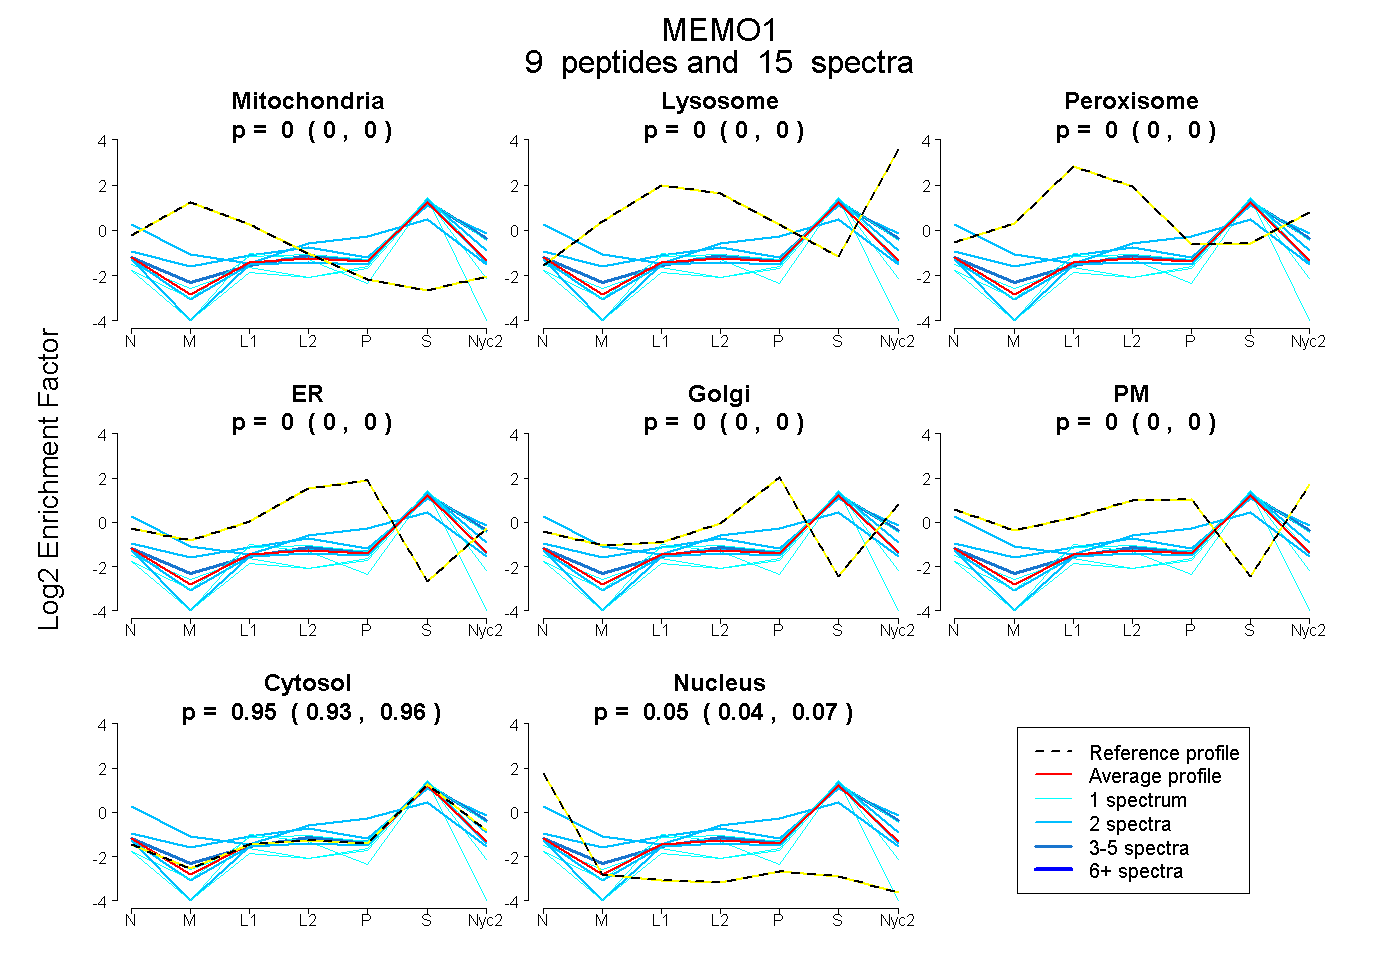
 9
9peptides
spectra
0.000 | 0.000
0.000 | 0.000
0.000 | 0.000
0.000 | 0.000
0.000 | 0.000
0.000 | 0.000
0.928 | 0.960
0.037 | 0.068
| Plot | Mito | Lyso | Perox | ER | Golgi | PM | Cytosol | Nucleus | |||||
| Expt A |
9 peptides |
15 spectra |
|
0.000 0.000 | 0.000 |
0.000 0.000 | 0.000 |
0.000 0.000 | 0.000 |
0.000 0.000 | 0.000 |
0.000 0.000 | 0.000 |
0.000 0.000 | 0.000 |
0.946 0.928 | 0.960 |
0.054 0.037 | 0.068 |
| 2 spectra, CALSSVDIYR | 0.000 | 0.000 | 0.000 | 0.000 | 0.000 | 0.000 | 0.956 | 0.044 | ||
| 1 spectrum, AIIAPHAGYTYCGSCAAHAYK | 0.000 | 0.000 | 0.000 | 0.000 | 0.000 | 0.000 | 0.877 | 0.123 | ||
| 3 spectra, IYGELWK | 0.000 | 0.032 | 0.000 | 0.000 | 0.000 | 0.026 | 0.942 | 0.000 | ||
| 2 spectra, YHNTICGR | 0.080 | 0.000 | 0.000 | 0.252 | 0.000 | 0.000 | 0.565 | 0.103 | ||
| 1 spectrum, TGMFER | 0.000 | 0.032 | 0.000 | 0.000 | 0.000 | 0.000 | 0.968 | 0.000 | ||
| 2 spectra, EQEFGK | 0.021 | 0.086 | 0.040 | 0.000 | 0.000 | 0.048 | 0.805 | 0.000 | ||
| 1 spectrum, SIEHLDK | 0.000 | 0.000 | 0.000 | 0.000 | 0.000 | 0.000 | 0.773 | 0.227 | ||
| 1 spectrum, YSYYDESQGEIYR | 0.000 | 0.000 | 0.000 | 0.000 | 0.000 | 0.000 | 0.944 | 0.056 | ||
| 2 spectra, TPLYDLR | 0.000 | 0.000 | 0.000 | 0.000 | 0.000 | 0.000 | 0.973 | 0.027 |
| Plot | Mito | Lyso or Perox | ER | Golgi | PM | Cytosol | Nucleus | ||||||
| Expt B |
2 peptides |
2 spectra |
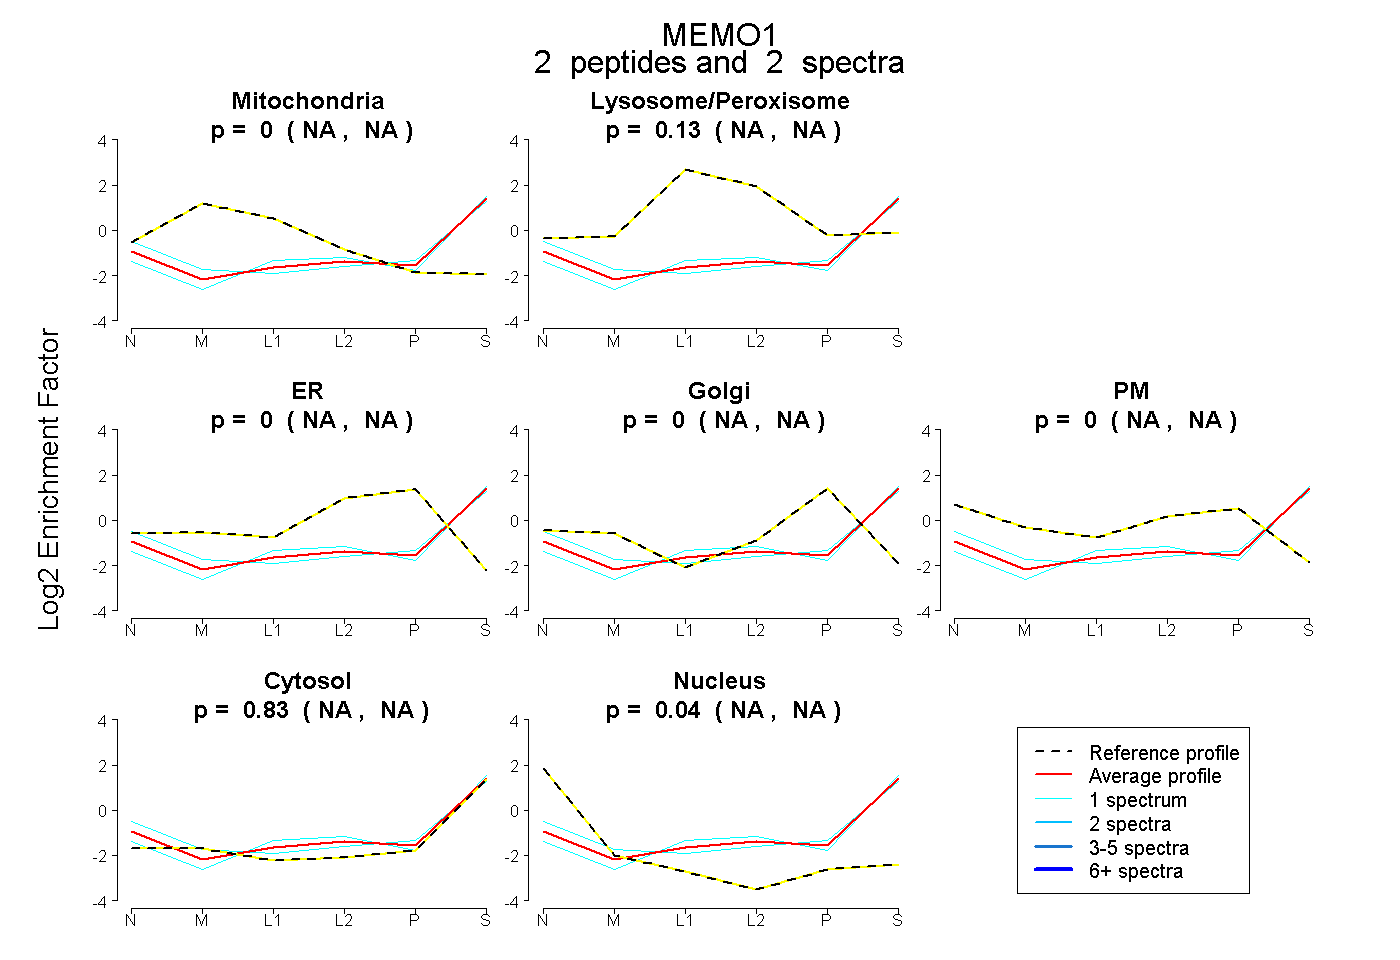 |
0.000 NA | NA |
0.129 NA | NA |
0.000 NA | NA |
0.000 NA | NA |
0.000 NA | NA |
0.828 NA | NA |
0.043 NA | NA |
|||
| Plot | Lyso | Other | |||||||||||
| Expt C |
3 peptides |
12 spectra |
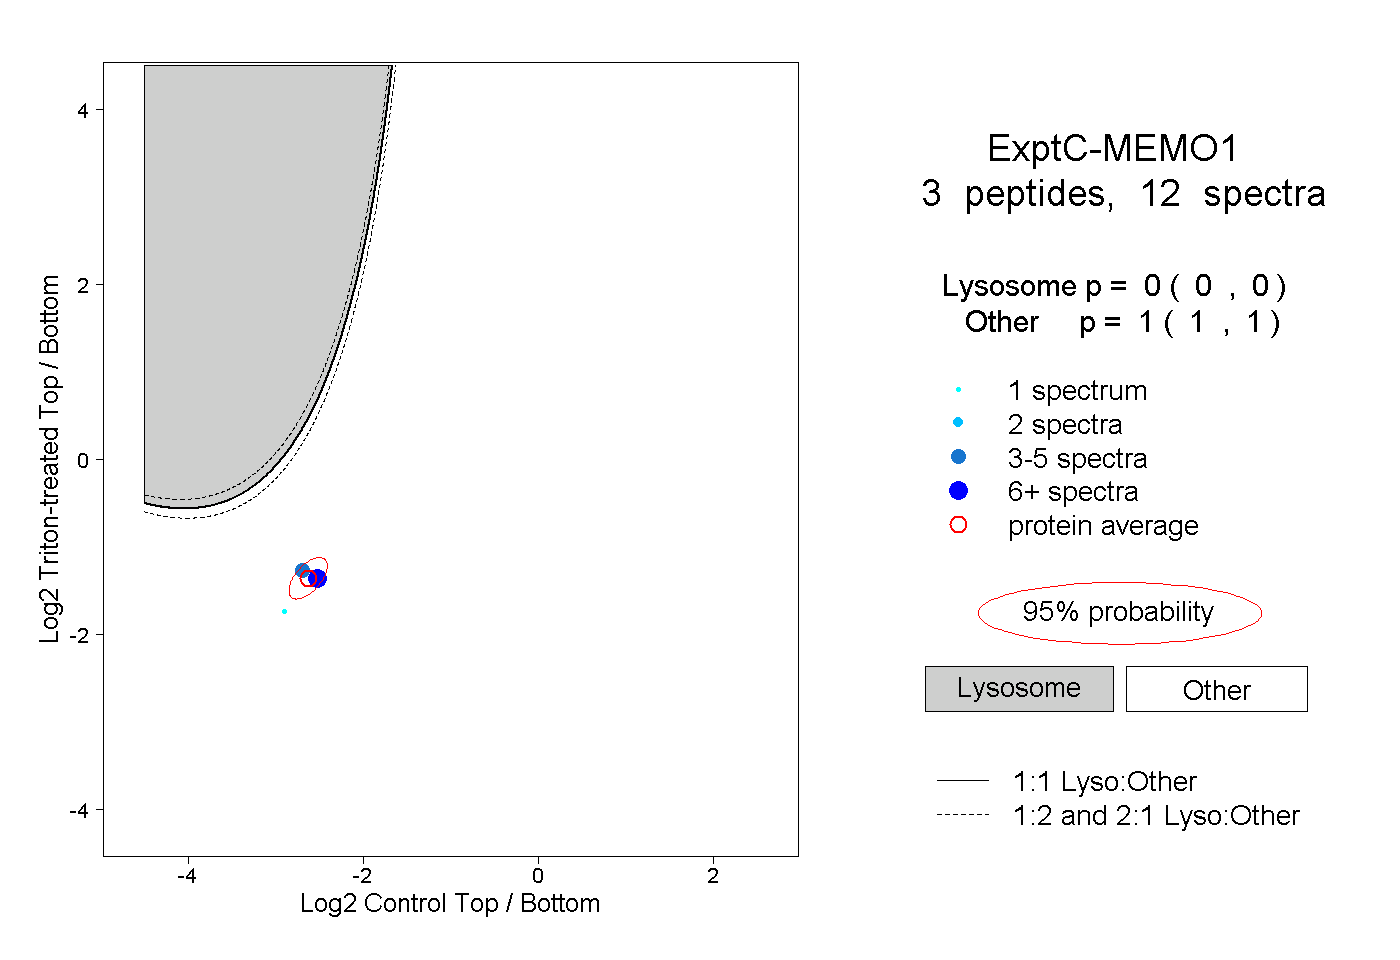 |
0.000 0.000 | 0.000 |
1.000 1.000 | 1.000 |
||||||||
| Plot | Lyso | Other | |||||||||||
| Expt D |
4 peptides |
6 spectra |
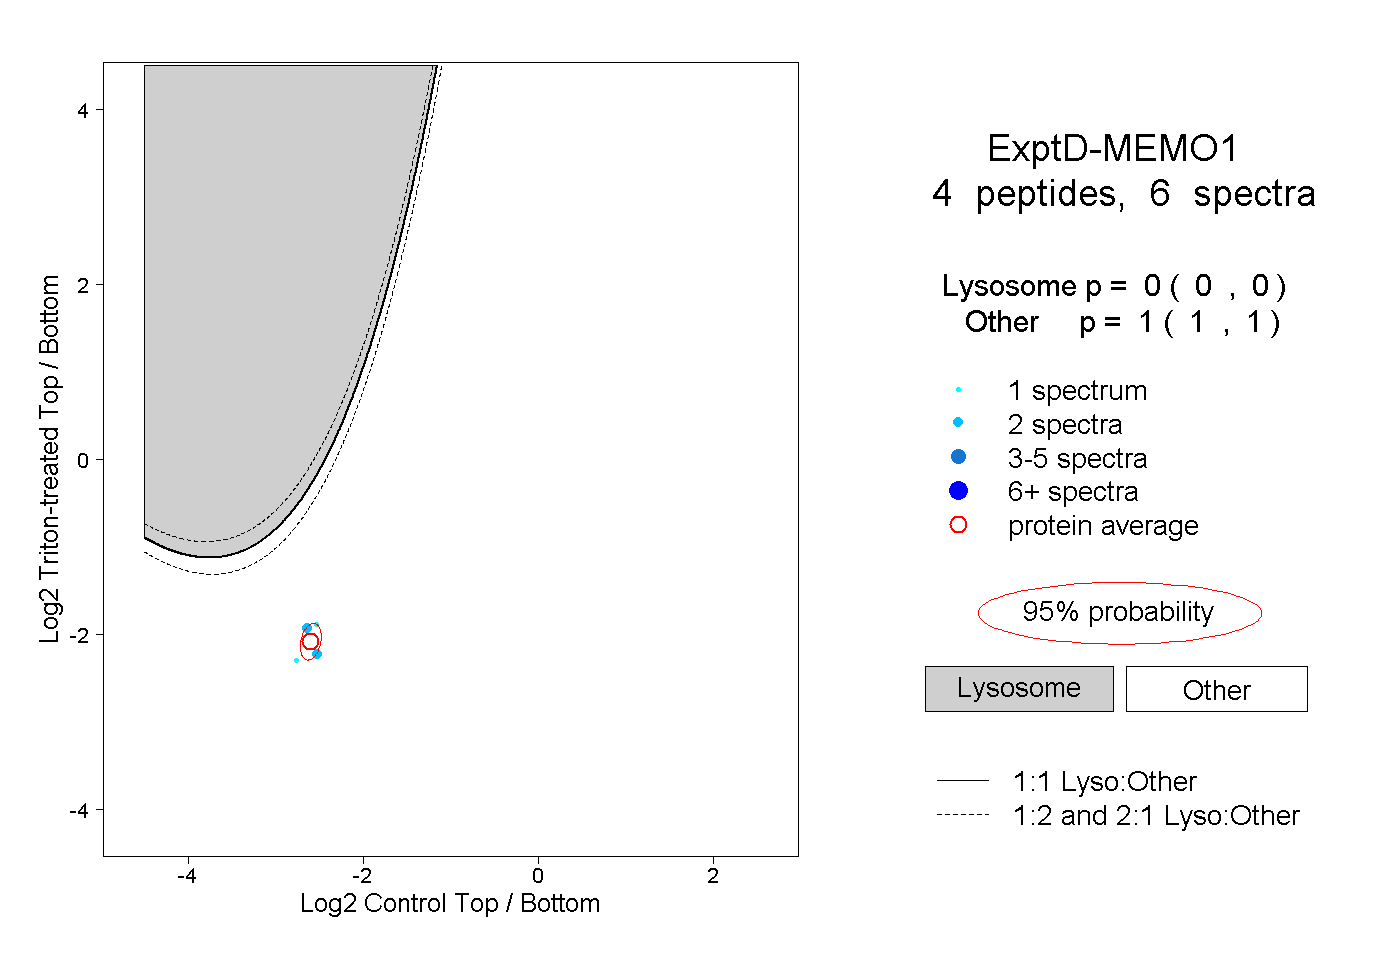 |
0.000 0.000 | 0.000 |
1.000 1.000 | 1.000 |