 2
2peptides
spectra
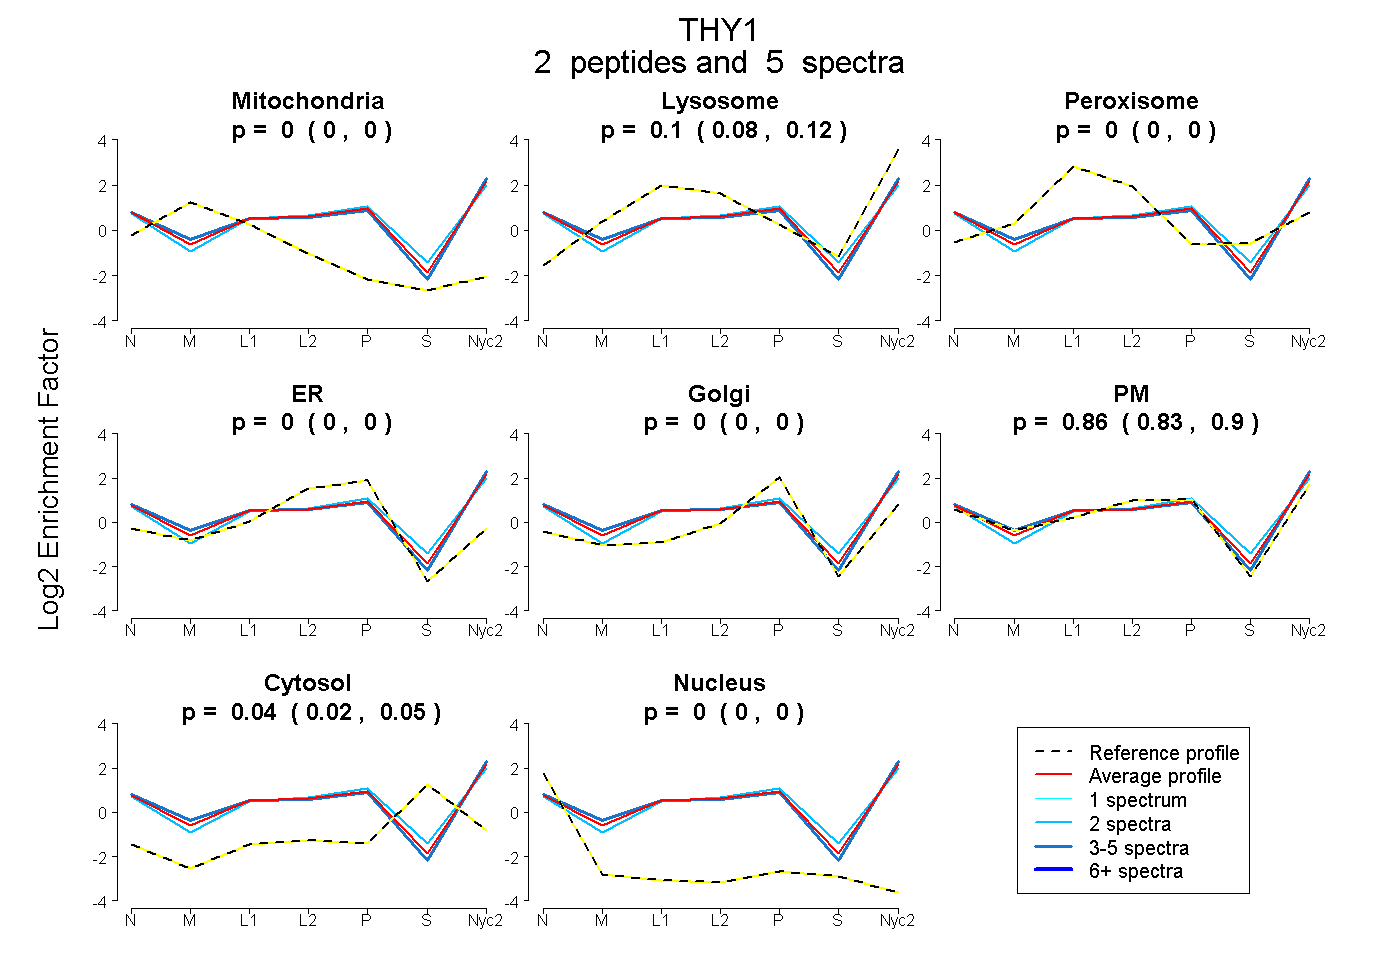
0.000 | 0.000
0.076 | 0.118
0.000 | 0.000
0.000 | 0.000
0.000 | 0.000
0.825 | 0.898
0.016 | 0.054
0.000 | 0.000
| Plot | Mito | Lyso | Perox | ER | Golgi | PM | Cytosol | Nucleus | |||||
| Expt A |
2 peptides |
5 spectra |
|
0.000 0.000 | 0.000 |
0.098 0.076 | 0.118 |
0.000 0.000 | 0.000 |
0.000 0.000 | 0.000 |
0.000 0.000 | 0.000 |
0.865 0.825 | 0.898 |
0.037 0.016 | 0.054 |
0.000 0.000 | 0.000 |
| 2 spectra, DEGDYMCELR | 0.000 | 0.098 | 0.000 | 0.000 | 0.000 | 0.801 | 0.101 | 0.000 | ||
| 3 spectra, VNLFSDR | 0.000 | 0.102 | 0.000 | 0.000 | 0.000 | 0.895 | 0.000 | 0.003 |
| Plot | Lyso | Other | |||||||||||
| Expt C |
1 peptide |
1 spectrum |
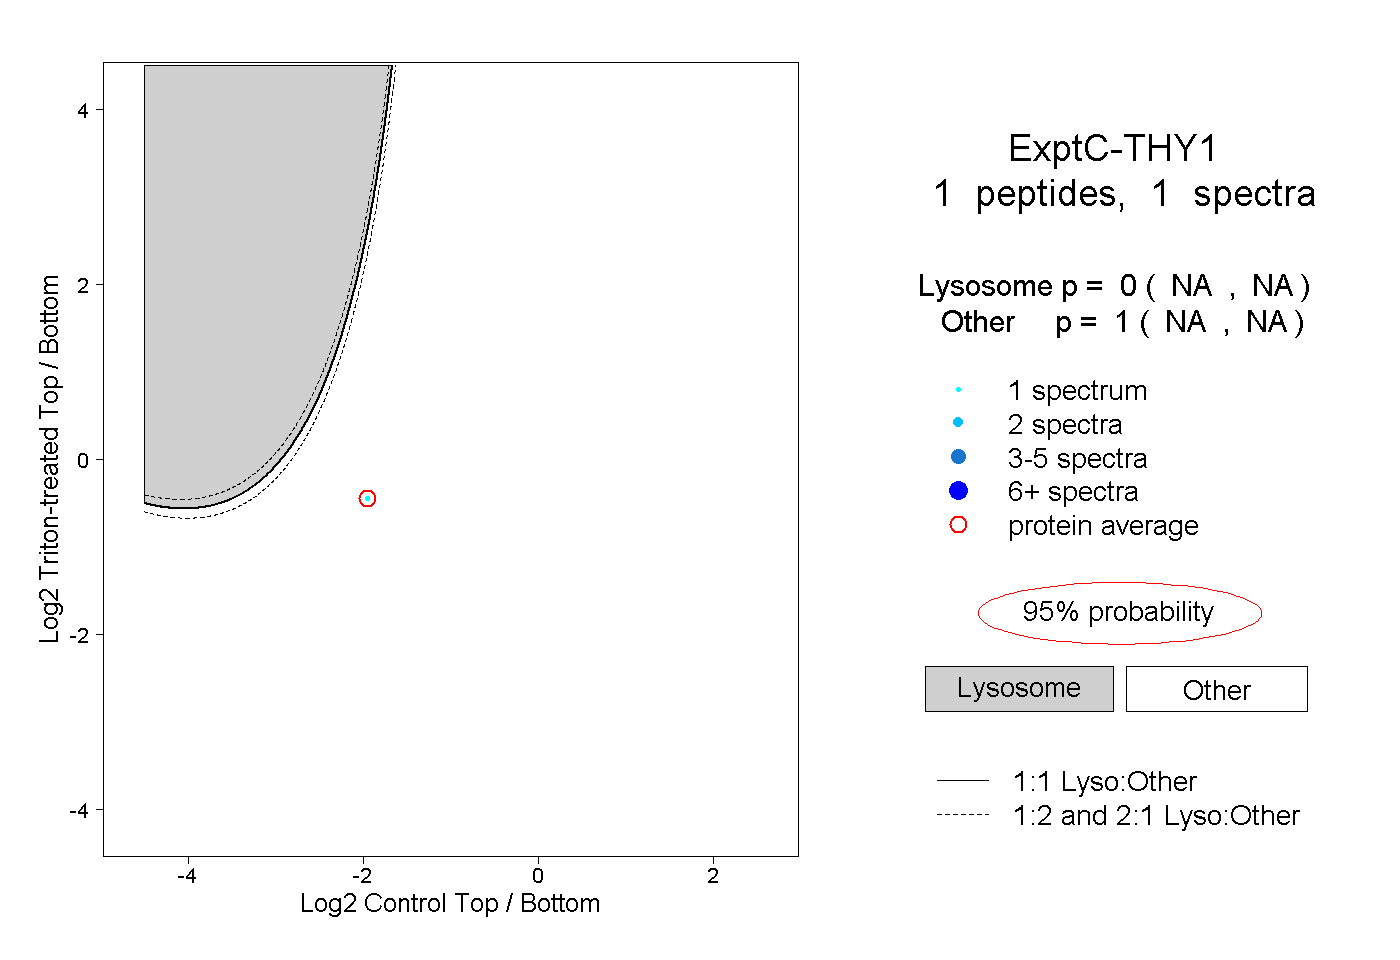 |
0.000 NA | NA |
1.000 NA | NA |