 2
2peptides
spectra
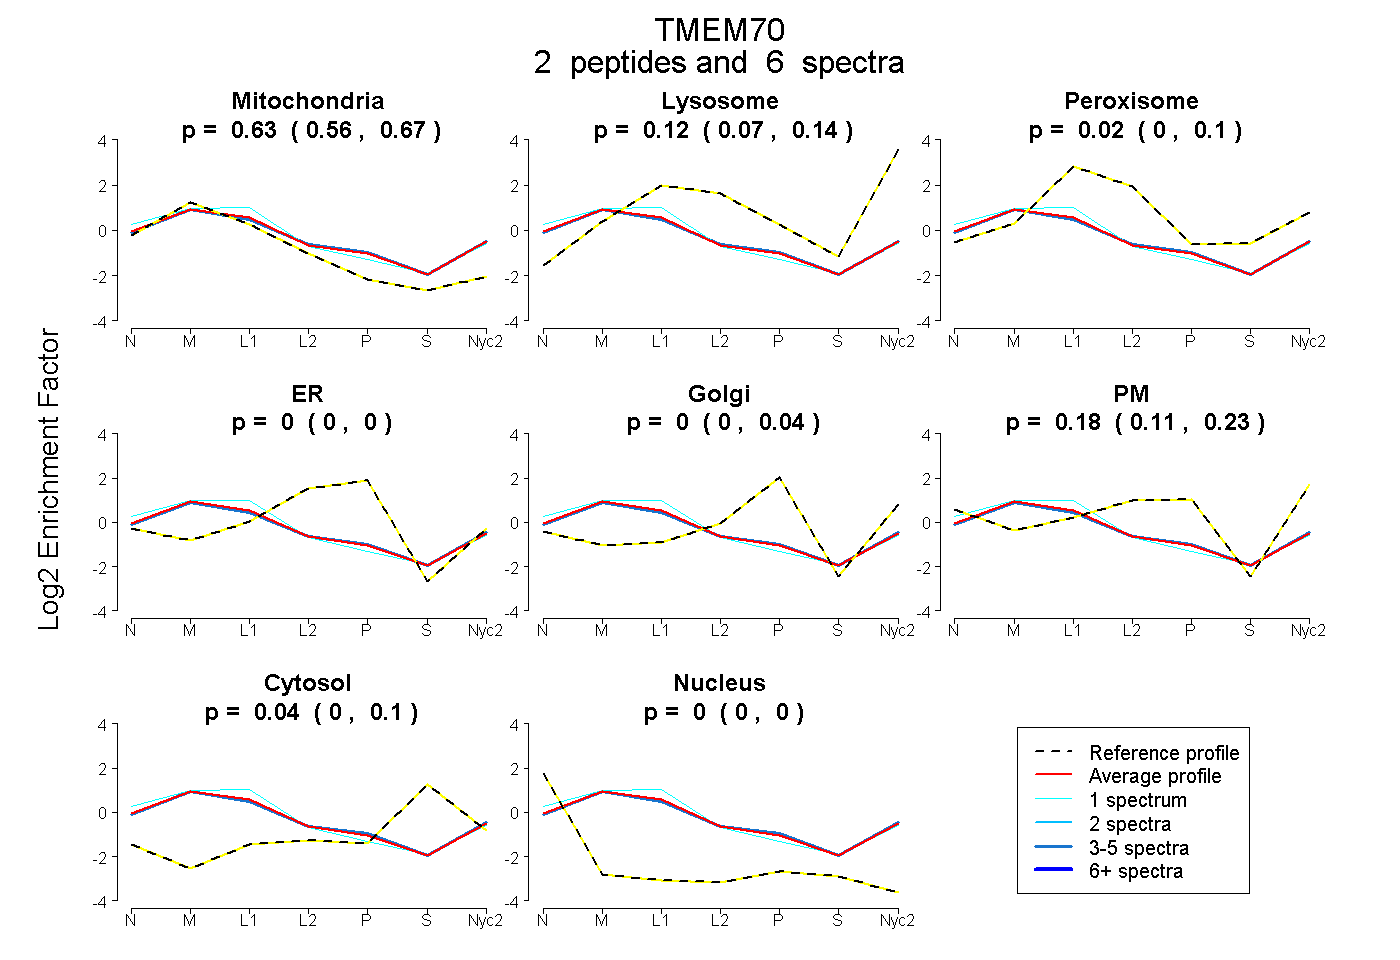
0.562 | 0.669
0.068 | 0.144
0.000 | 0.102
0.000 | 0.000
0.000 | 0.043
0.107 | 0.230
0.000 | 0.098
0.000 | 0.000
1peptide
spectra
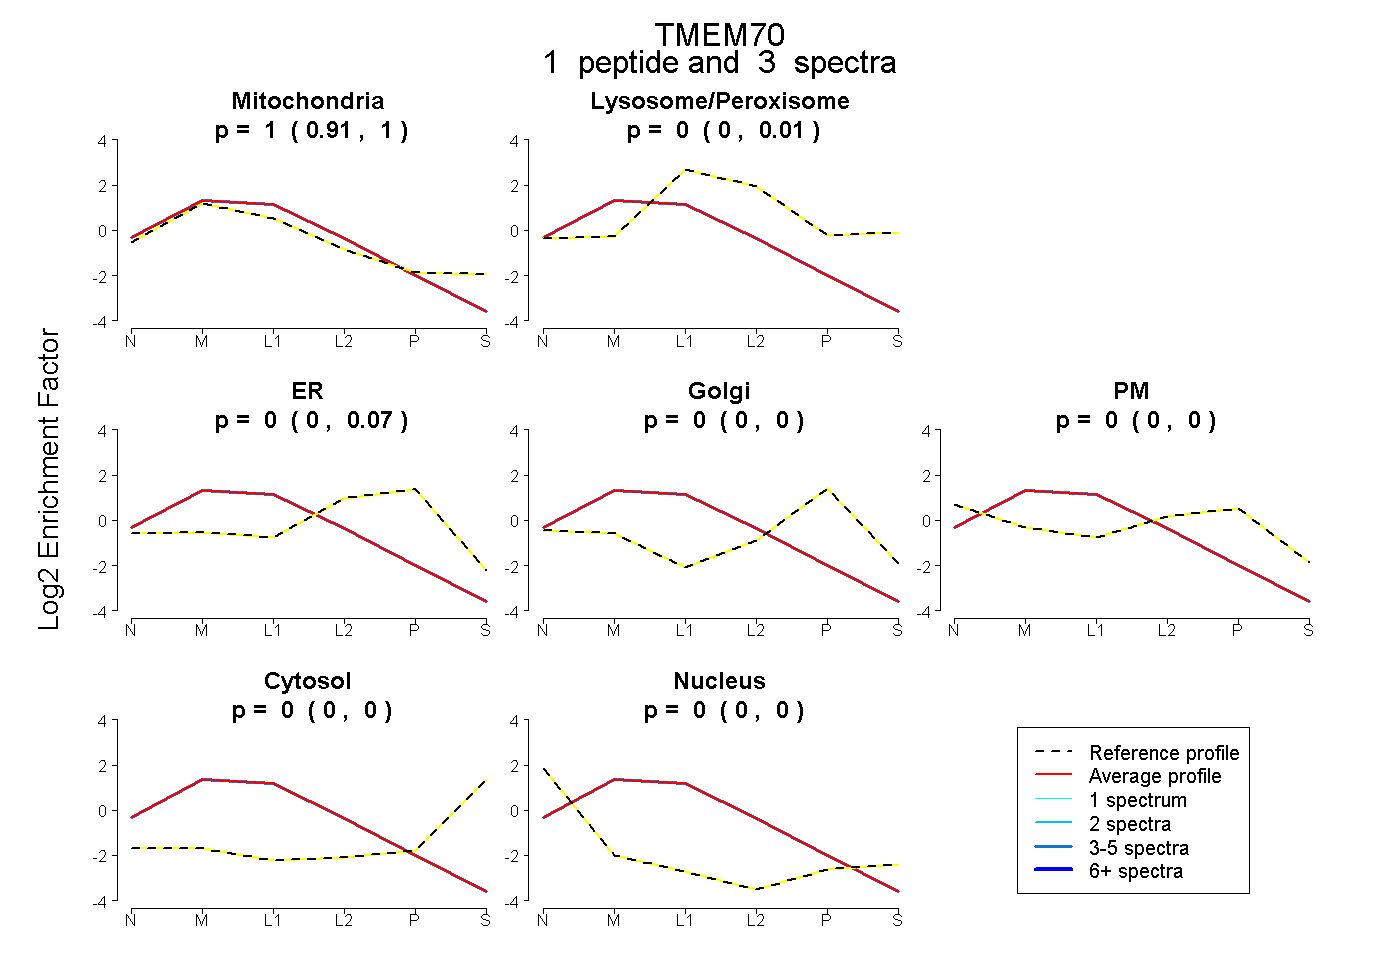
0.915 | 1.000
0.000 | 0.008
0.000 | 0.069
0.000 | 0.000
0.000 | 0.000
0.000 | 0.000
0.000 | 0.000
4peptides
spectra
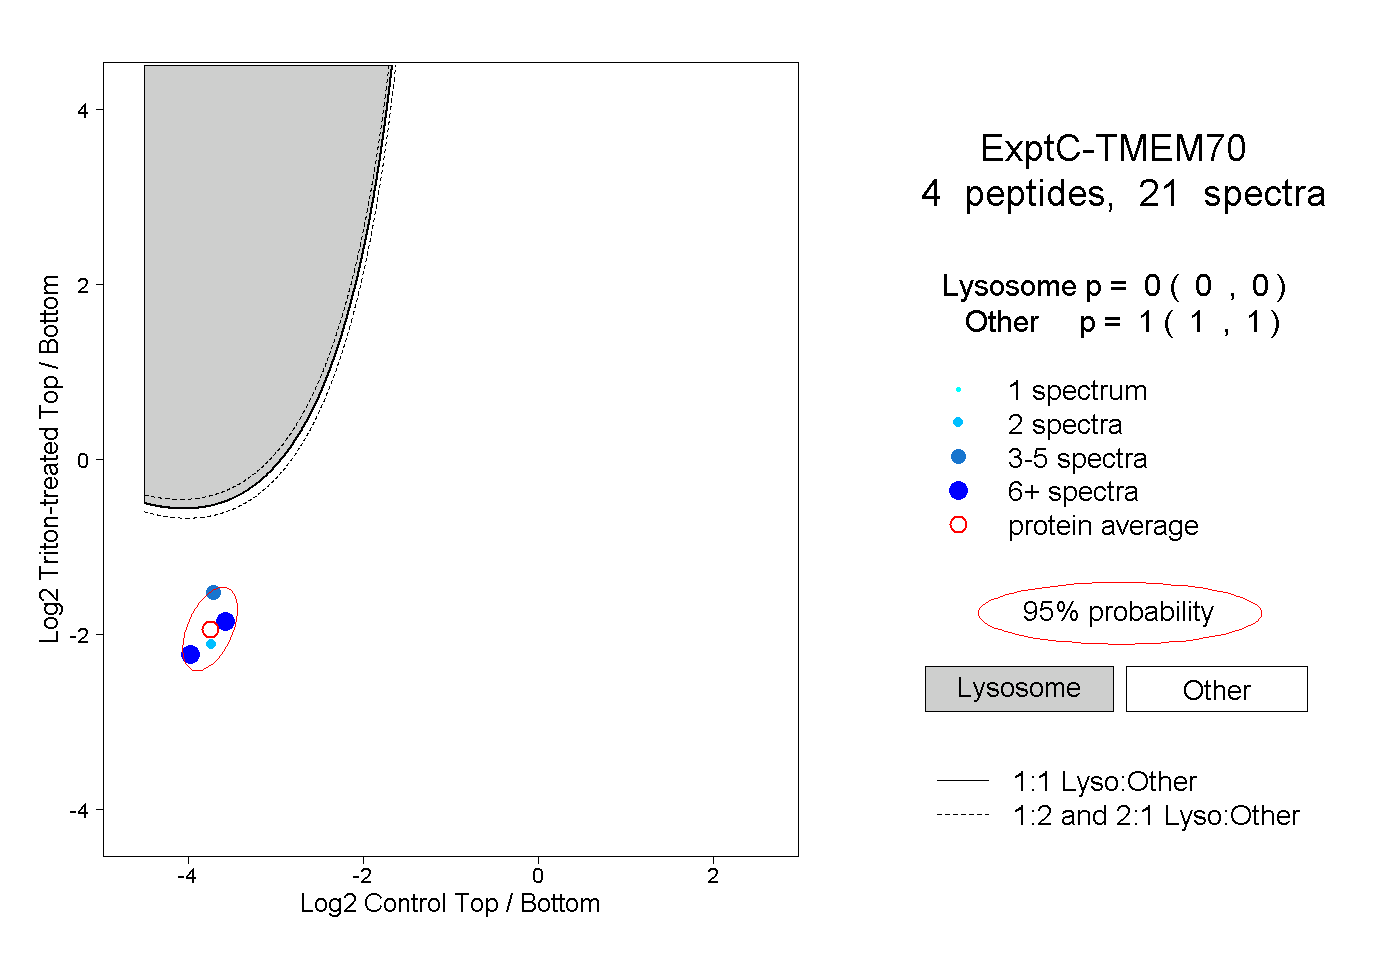
0.000 | 0.000
1.000 | 1.000
1peptide
spectra
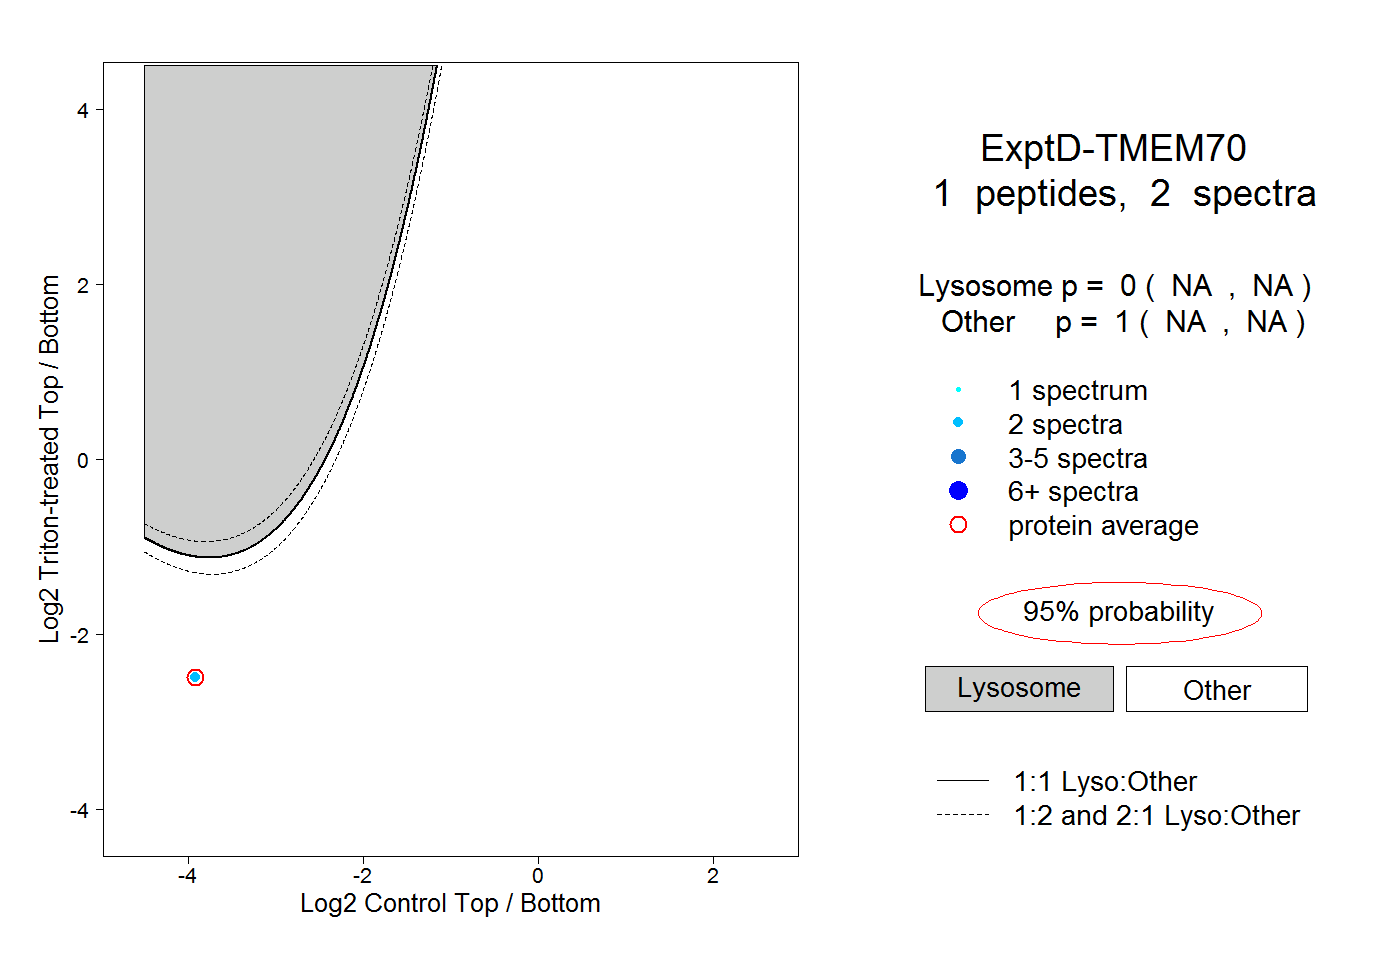
NA | NA
NA | NA